


383,809
社区成员
 发帖
发帖 与我相关
与我相关 我的任务
我的任务
 分享
分享今日用到了一个非常优秀的图表插件——Echarts
官网:https://echarts.apache.org/zh/index.html
这是一个基于 JavaScript 的开源可视化图表库,你可以在任何使用JS的前端用他来实现图表
使用方式也非常非常简单
这里基于VUE2来讲述使用方式
一、安装
需要注意的是VUE2建议安装4.9版本,否则可能会造成兼容性报错
cnpm install echarts@4.9.0 (没装镜像的就用npm吧)
二、在项目里引用
这边建议进行全局配置
在main.js中增加
//添加echarts
import * as echarts from "echarts"
Vue.prototype.$echarts = echarts;
三、在项目中使用
使用时只需要知道四点即可
1.创建一个指定id的div
<div id='staticres' style='width:300px;height: 400px;'> </div>
2.创建一个画图方法
drawChart() {
      // 基于准备好的dom,初始化echarts实例  这个和上面的div id对应
    let myChart = this.$echarts.init(document.getElementById('staticres'))
      const params={
        startDate:this.dateBegin,
        endDate:this.dateEnd,
        item:this.testItem,
      }
      postAction(this.url.getResReportData, params).then((res) => {
        if (res.success) {
          console.log(res)
          this.xAxisData=res.result.items;
          this.seriesData=res.result.datas;
          // 指定图表的配置项和数据
          let option = {
            title: {
              text: '资源使用情况'
            },
            tooltip: {},
            legend: {
              data: ['资源使用']
            },
            xAxis: {
              data:this.xAxisData,
              axisLabel: {
                interval: 0,
                rotate: 30
              },
            },
            yAxis: {
              max:120,
              axisLabel: {
                formatter: '{value} %',
                align: 'right',

              }
            },
            series: [
              {
                name: '资源使用',
                type: 'bar',
                data: this.seriesData,
                color: '#287AC2',
                barMinHeight: 2,
                barWidth:'50%',
                itemStyle:{
                  normal:{
                    label:{
                      show: true, //开启显示
                      position: 'top', //在上方显示
                      formatter:function(val){
                        if(val.value===0){
                          return '0%'
                        }else{
                          return parseFloat(val.value).toFixed(1)+'%';
                        }
                        }
                      }
                    }
                  },
                markLine: {
                  silent: true,
                  lineStyle: {
                    normal: {
                      color: '#F77B31'                   // 这儿设置安全基线颜色
                    }
                  },
                  data: [{
                    yAxis: 80
                  }],
                  label: {
                    normal: {
                      formatter: '资源标线'           // 这儿设置安全基线
                    }
                  },
                }
                },

            ]
          }
          // 使用刚指定的配置项和数据显示图表。
          myChart.setOption(option)

        } else {
          this.$message.error('操作失败:' + res.message)
        }
      })

    },
这段代码里面的步骤为:
(1)声明对应DIV的变量
let myChart = this.$echarts.init(document.getElementById('staticres'))
(2)通过接口得到X Y轴的数据集合,这里视实际情况改变
(3)声明option,这是用于画图的一个js,可以从后端拼好传,也可以在前端写好主要格式代码,然后传参变量
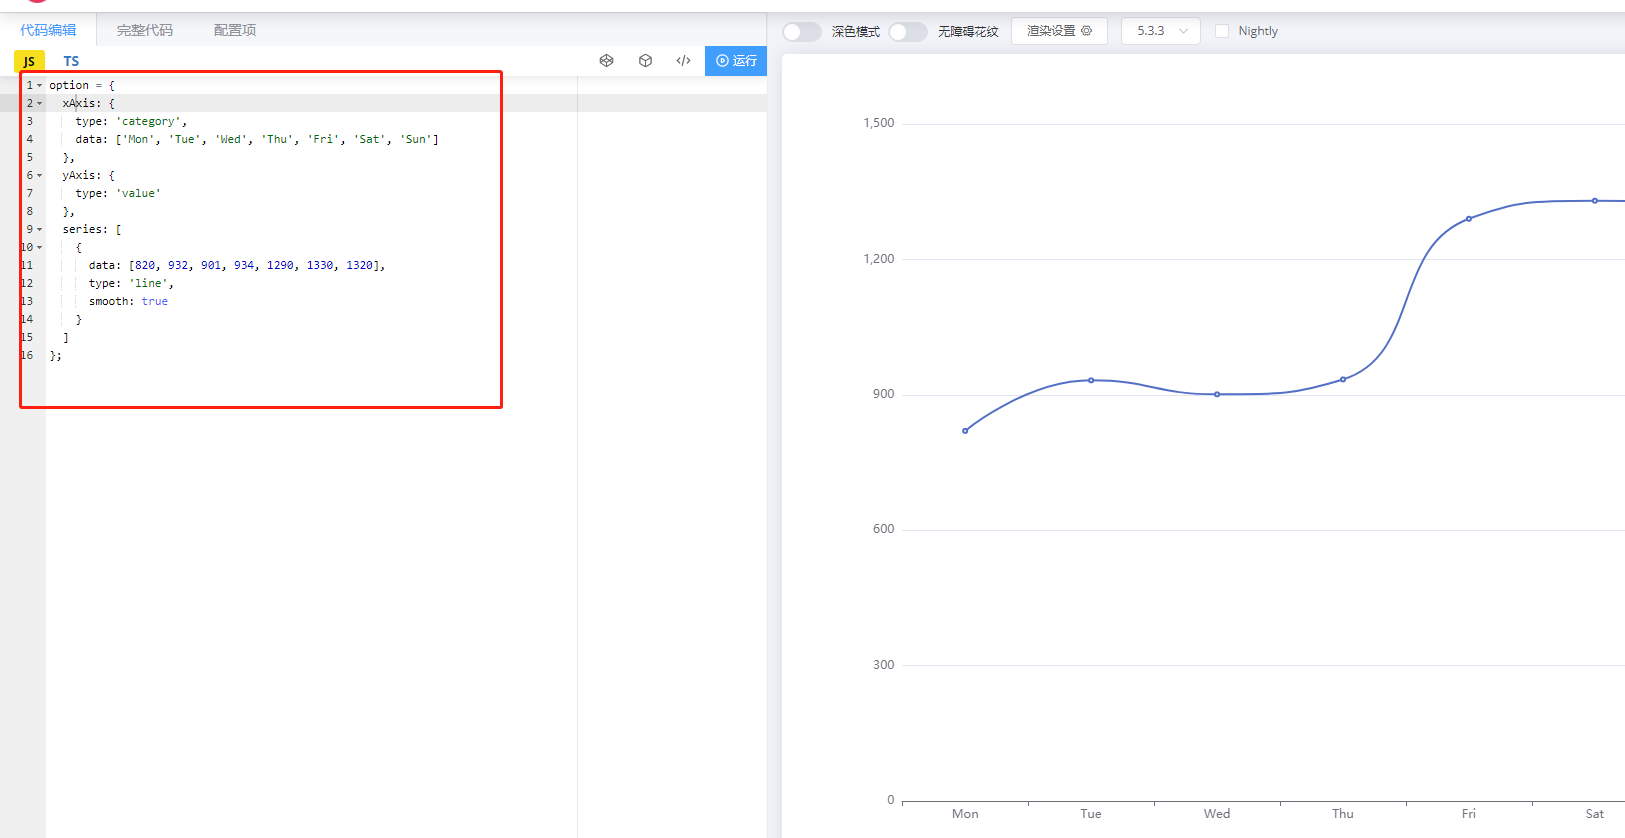
这段的内容可以从官网找到目标的示例点进去在代码编辑直接复制js
(4)使用刚指定的配置项和数据显示图表。
myChart.setOption(option)
以上就是使用方法啦,非常简单,可以在官网的代码编辑里把实例图表调整到所需样子再复制,会比较快。官网也有完整的开发文档,内容非常详细


