


286
社区成员
 发帖
发帖 与我相关
与我相关 我的任务
我的任务
 分享
分享| The Link Your Class | https://bbs.csdn.net/forums/MUEE308FZU202201 | |
| ||
| The Aim of This Assignment | The prototype design | |
| MU STU ID and FZU STU ID | 20122217/832001320 | |
| Teammate ID | 20122195/832001308 | |
| Teammate blog | EE308_LAB2-1-CSDN社区 |
| Personal Software Process Stages | Estimated Time/minutes | Completed Time/minutes |
|---|---|---|
| Planning | 40 | 40 |
| Estimate | 30 | 30 |
| Development | 30 | 30 |
| Analysis | 30 | 30 |
| Design Spec | 30 | 30 |
| Design Review | 30 | 30 |
| Coding Standard | 30 | 30 |
| Design | 120 | 200 |
| Coding | 30 | 30 |
| Code Review Planning | 30 | 30 |
| Test | 10 | 10 |
| Reporting | 30 | 30 |
| Test Report | 30 | 30 |
| Size Measurement | 10 | 10 |
| Postmortem&Process Improvement | 30 | 30 |
| total | 510 | 510 |
Bobing is a popular entertainment activity during the Mid-Autumn Festival in Southern Fujian. It use six dice thrown to determine the participants' prizes. Nowadays, Bobing is still a classic activity of Fujian people's Mid-Autumn Festival. But it was limited by the area and facility.
The people far away home can't play with their families .
Lots of people waste time because of the differences of rules between different areas.
Importantly, its difficult to gather enough dice for gaming.
“It seems like developing a software about Bobing is necessary.”
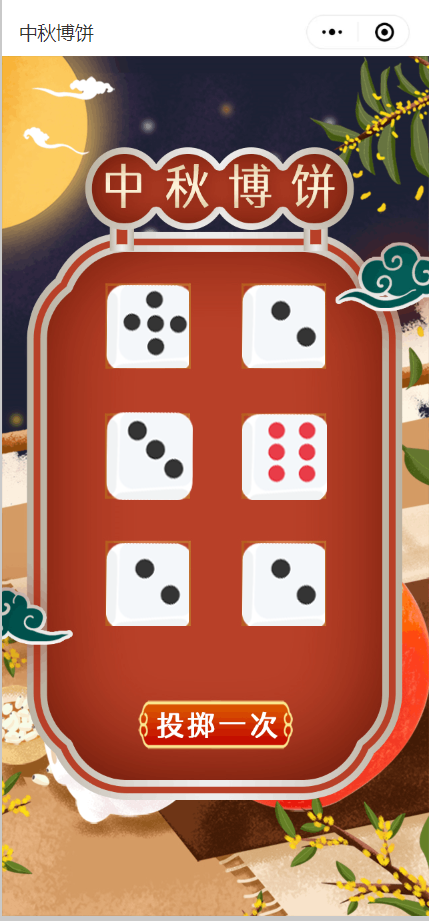
For the prototype design, our team used the software AXURE PR9. We used a beautiful image as the background, set up a few buttons for a few simple interactions. Then on the back end we used unity and VS for programming.We expect programming in VS and visualizing in unity.
Online programs comply with epidemic prevention regulations,Many functions, Interesting and funny,One key trial play, convenient and fast。
Compared to existing programs, our work is more humanized,We have more functions, can match different people's demand
Promote through wechat platform,Combined with restaurants, KTV, and other public entertainment places to conduct trial cooperation to promote
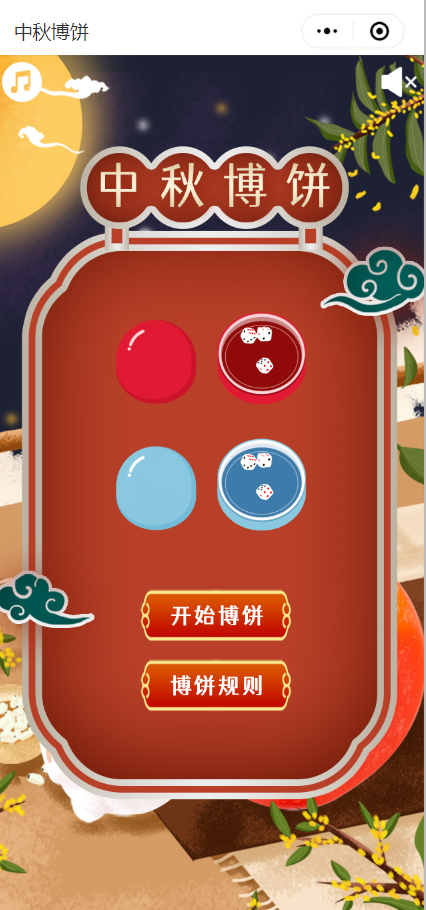
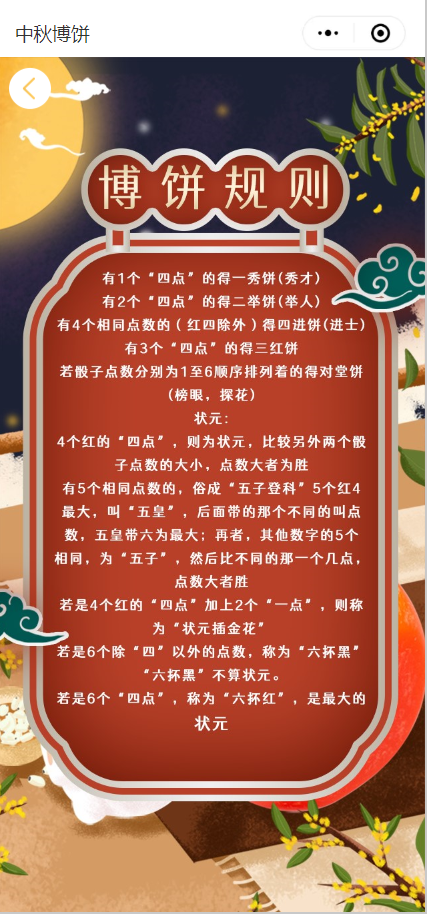
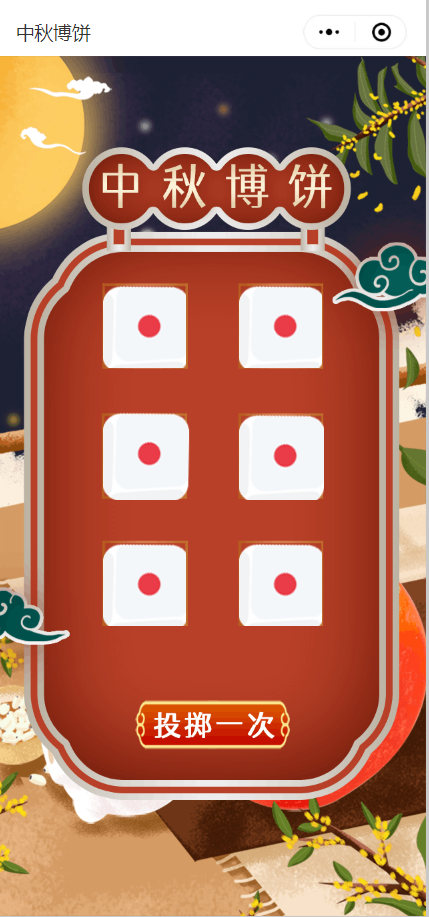
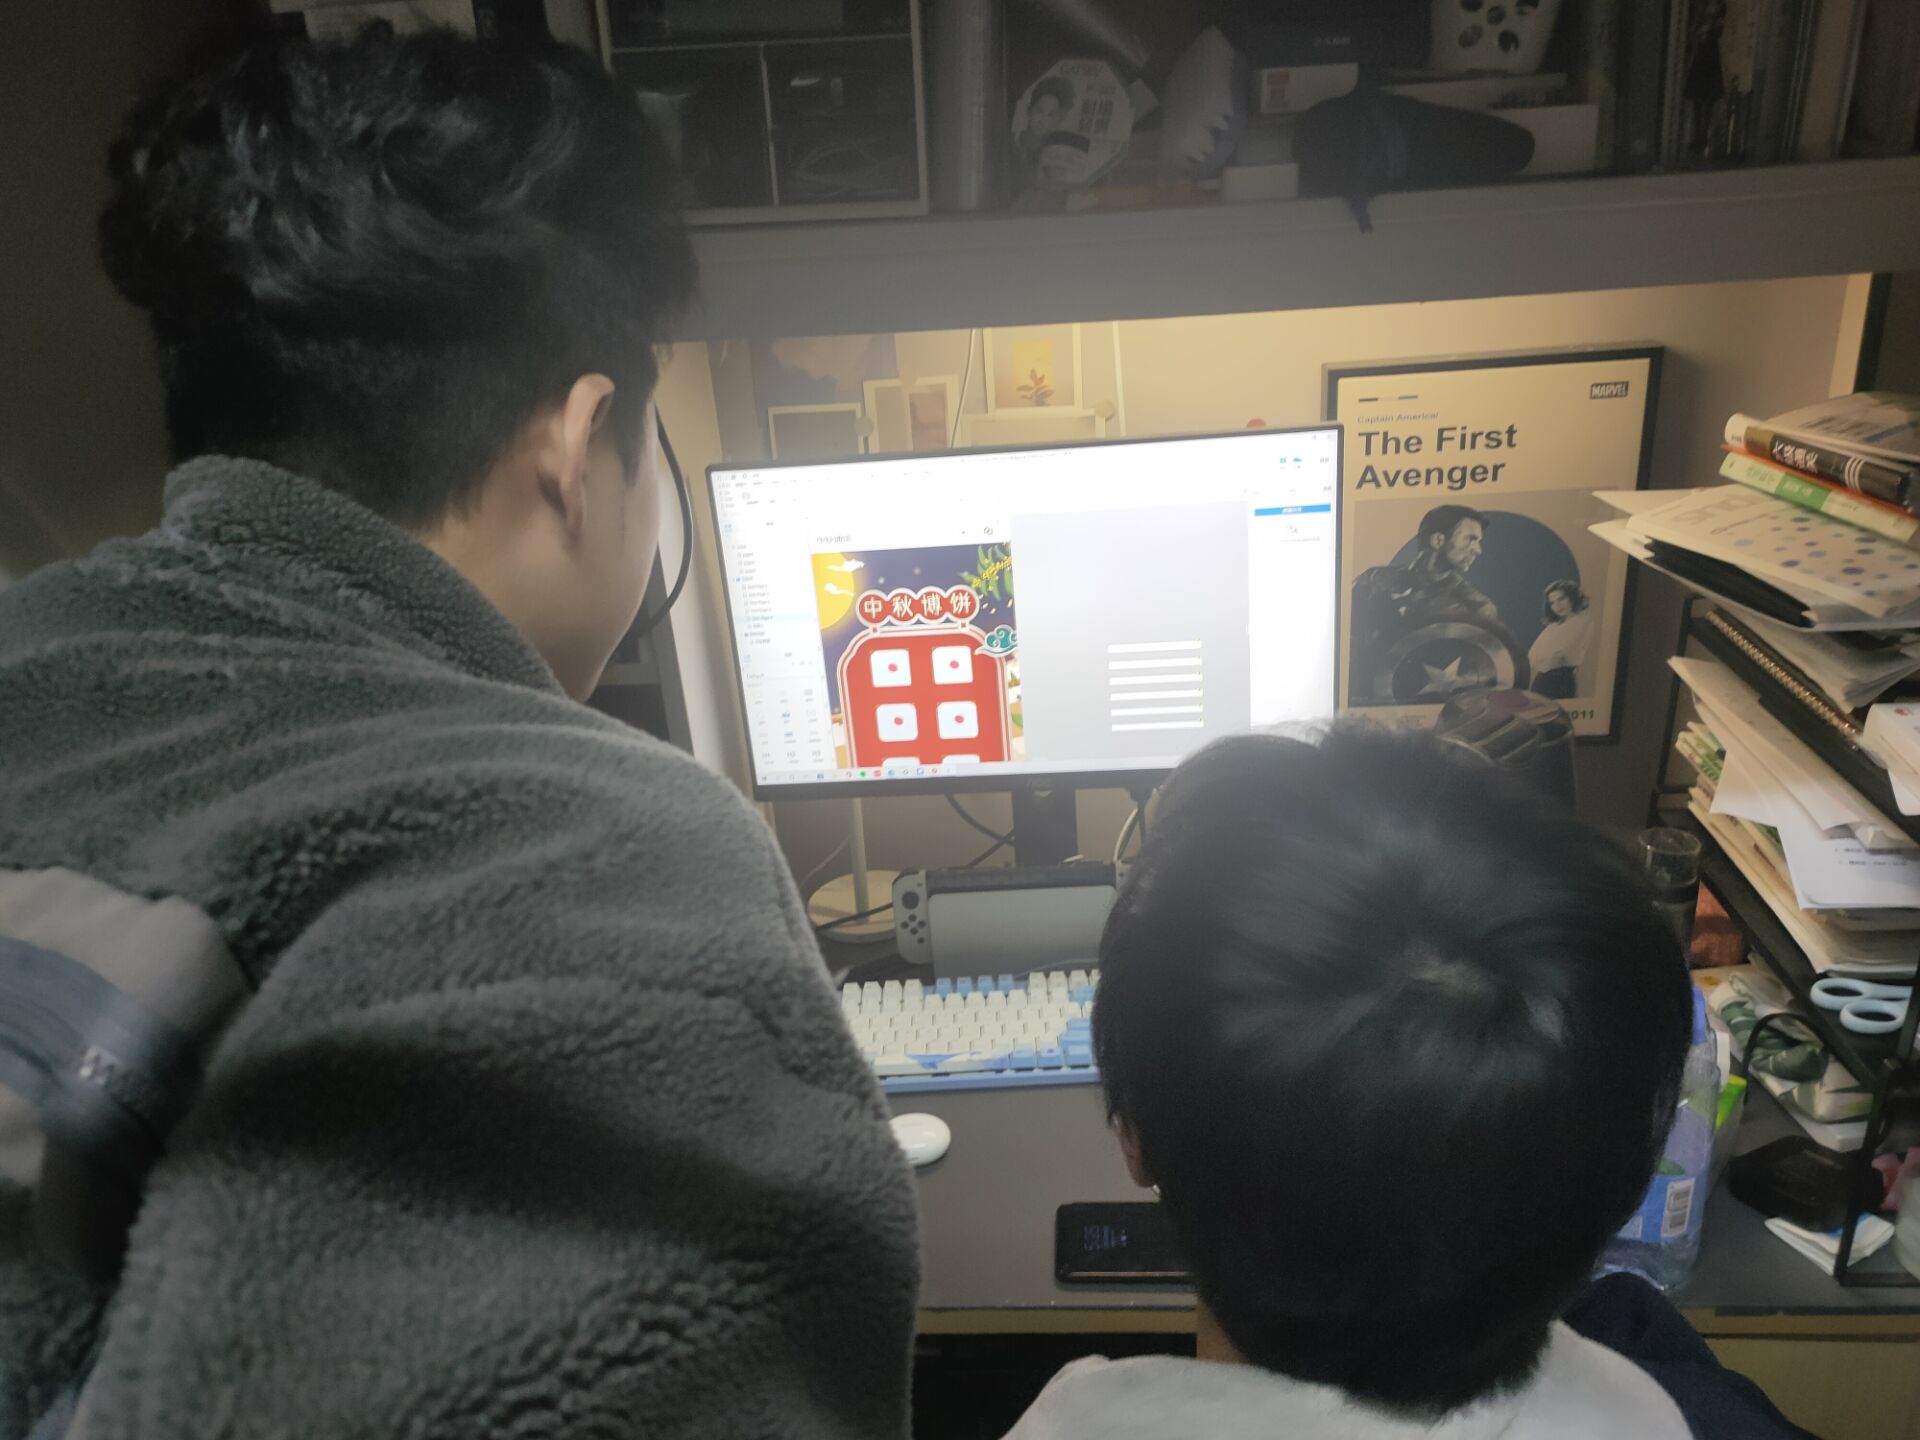
Paired Work Photo
I have come into the software engineering course for the first move indeed with the lab.Actually i start to fall in love with the product manager's job, as they provide prototype for the whole program and decide the main style and functions which also connected with the economy. I hope the future labs can give us more inspirations.

