

32
社区成员
 发帖
发帖 与我相关
与我相关 我的任务
我的任务
 分享
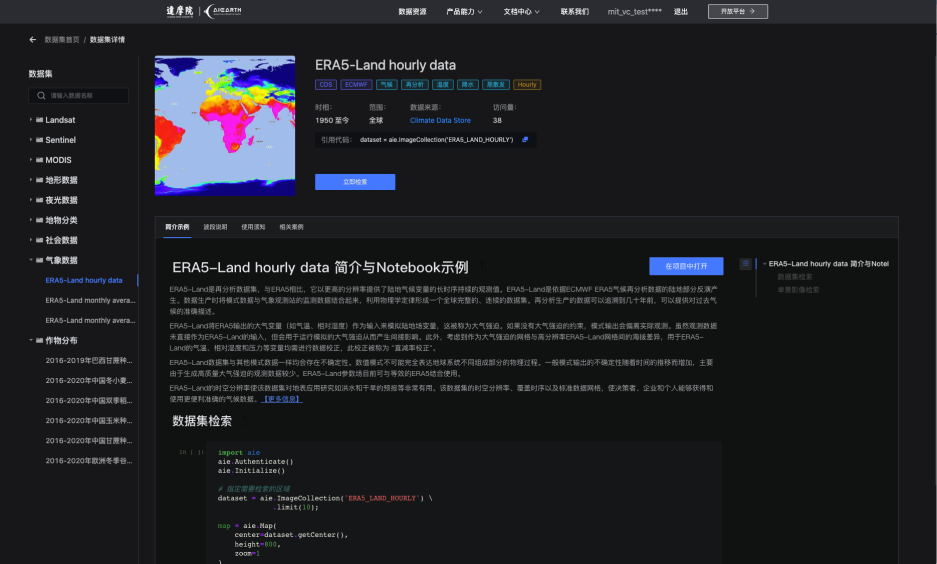
分享气象数据集(ERA5-Land)
ERA5-Land是气候再分析数据集,与ERA5相比,提供了更高分辨率的陆地气象要素长时序持续的观测值。ERA5-Land是ECMWF ERA5气候再分析数据的陆地部分反演生产的。生产时将气候模式数据与气象观测站的监测数据结合起来,利用物理学定律形成一套全球完整的、连续的数据集。
数据来源为 CDS(Copernicus Climate Data Store),其数据已被重新格点化为0.1°×0.1°的常规经纬度格点数据。关于数据的具体描述,可查阅官方网站:https://cds.climate.copernicus.eu/cdsapp#!/home
1、数据介绍
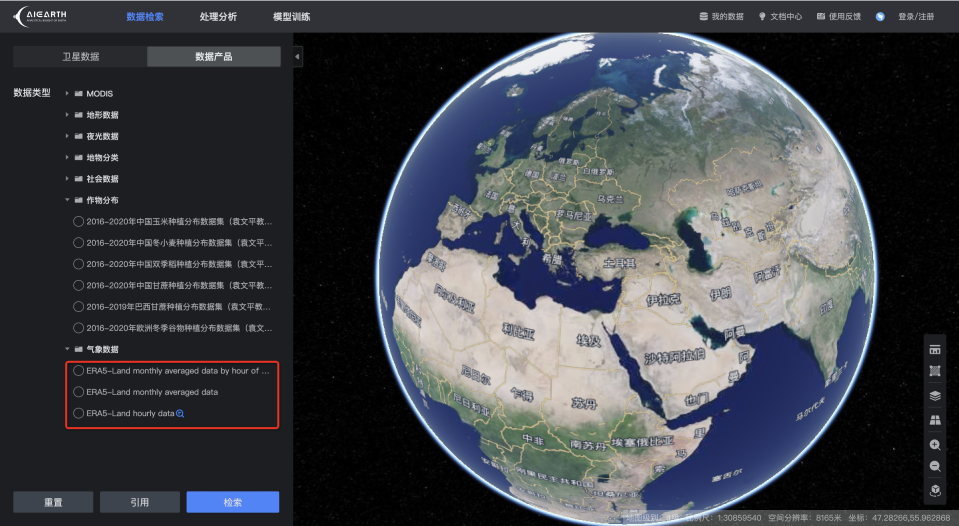
AI Earth平台目前上线ERA5-Land的3类数据产品,分别是ERA5-Land hourly data、ERA5-Land monthly averaged data、ERA5-Land monthly averaged data by hour of day ,ERA5-land 数据产品覆盖全球陆地区域1950-2022年共50类气象要素(包括温度、降水、大气压、辐射、蒸散发等),空间分辨率为0.1° x 0.1° (~9 km),数据将持续进行更新。
2、数据检索
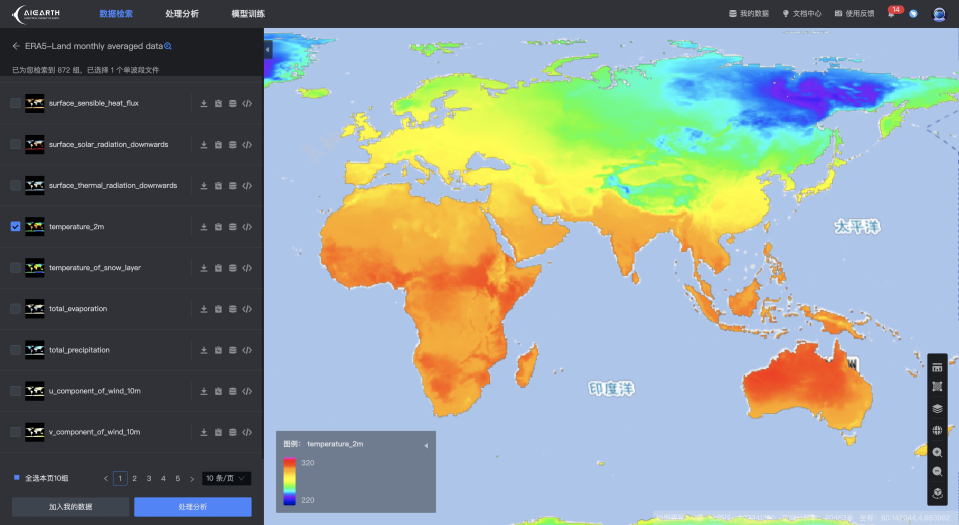
在数据产品列表下的气象数据中可以找到对应ERA5-Land 的3类数据产品。支持用户选择时间段进行数据检索。
3、开发者模式
可通过开发者模式调用ERA5-Land 的3类数据产品。如下为利用ERA5-Land monthly averaged data 数据进行平均气温的长时序气候态分析。
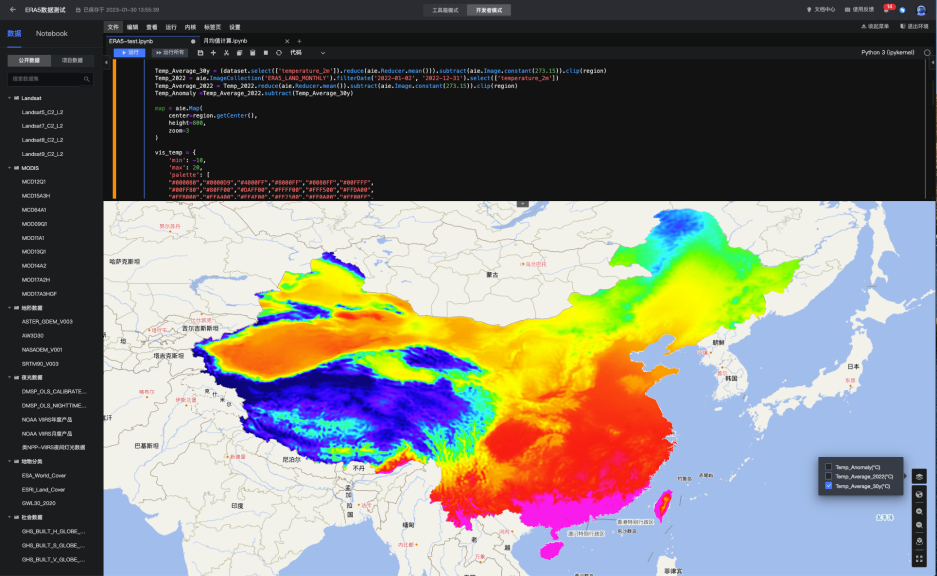
上图为中国区域1991-2020年30年年均温空间分布
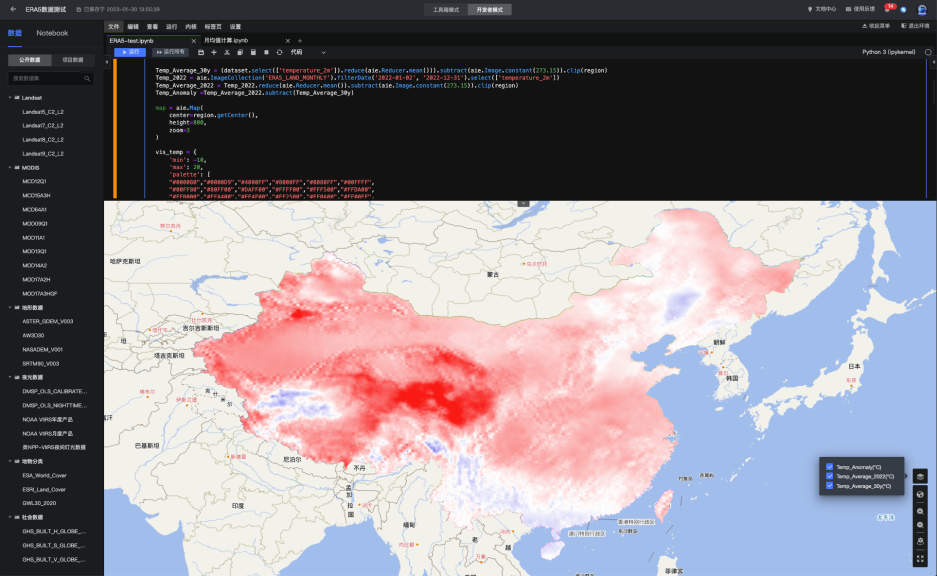
上图为中国区域2022年年均温距平空间分布(Baseline 1991-2020年)
部分代码如下,仅供参考,欢迎登录平台体验。如有任何疑问,欢迎随时与AI Earth联系交流。
import aie
aie.Authenticate()
aie.Initialize()

# 指定需要检索的区域
region = aie.FeatureCollection('China_Province').geometry()

#1991-2020 共30年 逐月均温,并将 K 转为 °C
dataset =  aie.ImageCollection('ERA5_LAND_MONTHLY').filterDate('1991-01-02', '2020-12-31')
print(dataset.size().getInfo())
# # size = dataset.size().getInfo()
# size = 360
# for i in range(size):
#     id = dataset.toList(count=size).getInfo()[i]['id']
#     print(id)
Temp_Average_30y = (dataset.select(['temperature_2m']).reduce(aie.Reducer.mean())).subtract(aie.Image.constant(273.15)).clip(region)

# 计算2022年年均温
Temp_2022 = aie.ImageCollection('ERA5_LAND_MONTHLY').filterDate('2022-01-02', '2022-12-31').select(['temperature_2m'])
Temp_Average_2022 = Temp_2022.reduce(aie.Reducer.mean()).subtract(aie.Image.constant(273.15)).clip(region)
Temp_Anomaly =Temp_Average_2022.subtract(Temp_Average_30y)

#可视化
map = aie.Map(
    center=region.getCenter(),
    height=800,
    zoom=3
)

vis_temp = {
    'min': -10,
    'max': 20,
    'palette': [
        "#000080","#0000D9","#4000FF","#8000FF","#0080FF","#00FFFF",
        "#00FF80","#80FF00","#DAFF00","#FFFF00","#FFF500","#FFDA00",
        "#FFB000","#FFA400","#FF4F00","#FF2500","#FF0A00","#FF00FF",
    ]
}

vis_temp_anomaly = {
    'min': -3,
    'max': 3,
    'palette': ['#0000D9','#ffffff','#FF0000']
}

map.addLayer(
    Temp_Average_30y,
    vis_temp,
    'Temp_Average_30y(°C)',
    bounds=dataset.getBounds()
)

map.addLayer(
    Temp_Average_2022,
    vis_temp,
    'Temp_Average_2022(°C)',
    bounds=dataset.getBounds()
)

map.addLayer(
    Temp_Anomaly,
    vis_temp_anomaly,
    'Temp_Anomaly(°C)',
    bounds=dataset.getBounds()
)
map

##计算全国30年月度平均温
#利用aie.Filter.calendarRange()函数筛选对应月份数据
def get_month_data(mon,parameter):
    dataset =  aie.ImageCollection('ERA5_LAND_MONTHLY')\
                  .filterDate('1991-01-02', '2020-12-31')\
                  .filter(aie.Filter.calendarRange(mon, None,'month'))\
                  .select([parameter])
    return dataset

x_temp_series = []
y_temp_series = []

for i in range(1,13):
    temp_mean = get_month_data(i,'temperature_2m').reduce(aie.Reducer.mean()).subtract(aie.Image.constant(273.15))
    temp_sta =temp_mean.reduceRegion(aie.Reducer.mean(), region, 10000)

    x_temp_series.append(str(i).zfill(2) + '月')
    y_temp_series.append(temp_sta.getInfo()['temperature_2m_mean'])

#绘制月度均温曲线图
from bqplot import pyplot as plt
plt.figure(1, title='1991-2020年全国逐月均温统计')
plt.plot(x_temp_series, y_temp_series)
plt.show()

AIE平台技术交流钉钉群,群号:32152986
