162
社区成员
 发帖
发帖 与我相关
与我相关 我的任务
我的任务
 分享
分享实验一:Series对象的应用
实验要求:
- 定义一个Series对象,包含5个整数数据;
- 访问、修改Series对象中的数据;
- 打印Series对象;
- 对Series对象进行计算,如求和、求平均值等。
示例代码:
import pandas as pd# 定义一个Series对象
s = pd.Series([10, 20, 30, 40, 50])
# 访问Series对象中的数据
print(s[0]) # 输出第一个元素
print(s[2:4]) # 输出第3个到第4个元素
# 修改Series对象中的数据
s[1] = 25
# 打印Series对象
print(s)# 对Series对象进行计算
print(s.sum()) # 求和
print(s.mean()) # 求平均值
修改后:
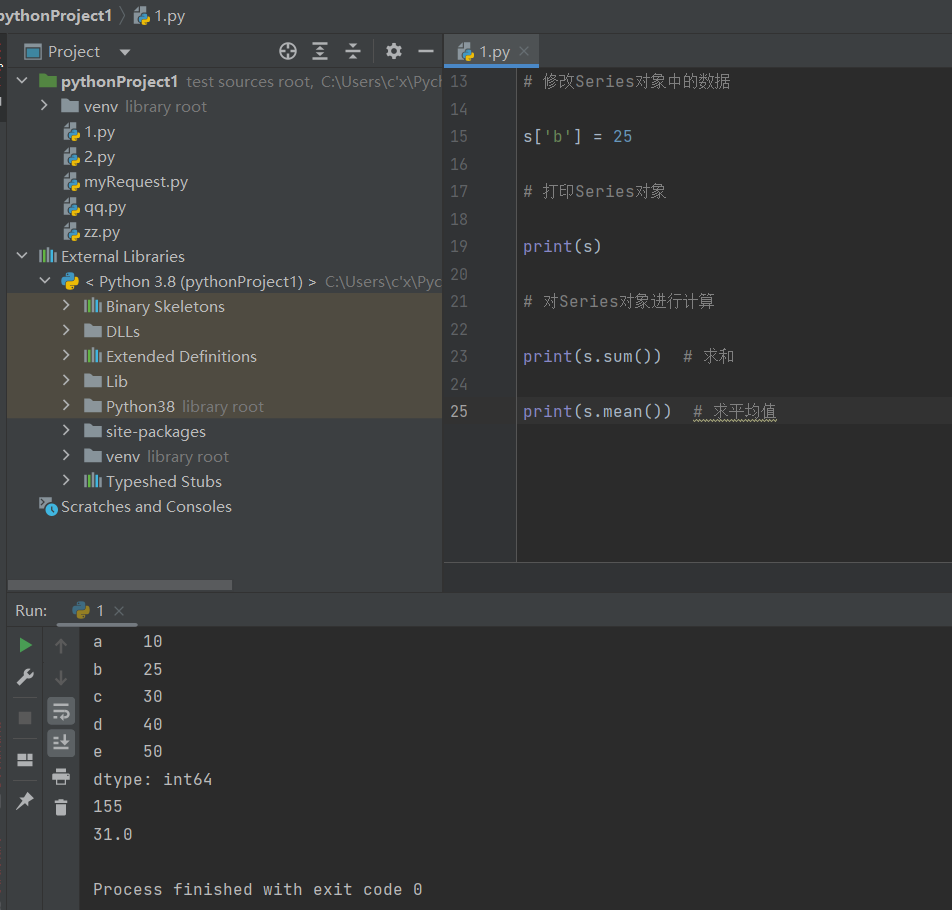
import pandas as pd


# 定义一个Series对象

s = pd.Series([10, 20, 30, 40, 50], index=['a', 'b', 'c', 'd', 'e'])


# 访问Series对象中的数据

print(s['a']) # 输出第一个元素

print(s['c':'e']) # 输出第3个到第5个元素


# 修改Series对象中的数据

s['b'] = 25


# 打印Series对象

print(s)


# 对Series对象进行计算

print(s.sum()) # 求和

print(s.mean()) # 求平均值
实验二:DataFrame对象的应用
要求:
import pandas as pd

# 定义一个DataFrame对象
data = {'int_col': [1, 2, 3, 4, 5], 'float_col': [1.2, 2.3, 3.4, 4.5, 5.6], 'str_col': ['a', 'b', 'c', 'd', 'e']}
df = pd.DataFrame(data)

# 访问DataFrame对象中的数据
print(df['float_col'][2])  # 输出第三行第二列的数据
print(df.loc[3, 'str_col'])  # 输出第四行第三列的数据

# 修改DataFrame对象中的数据
df.loc[4, 'int_col'] = 6

# 对DataFrame对象进行计算
print(df.sum())  # 求和
print(df.mean())  # 求平均值
修改的意图:
修改后的代码:
import pandas as pd
import matplotlib.pyplot as plt
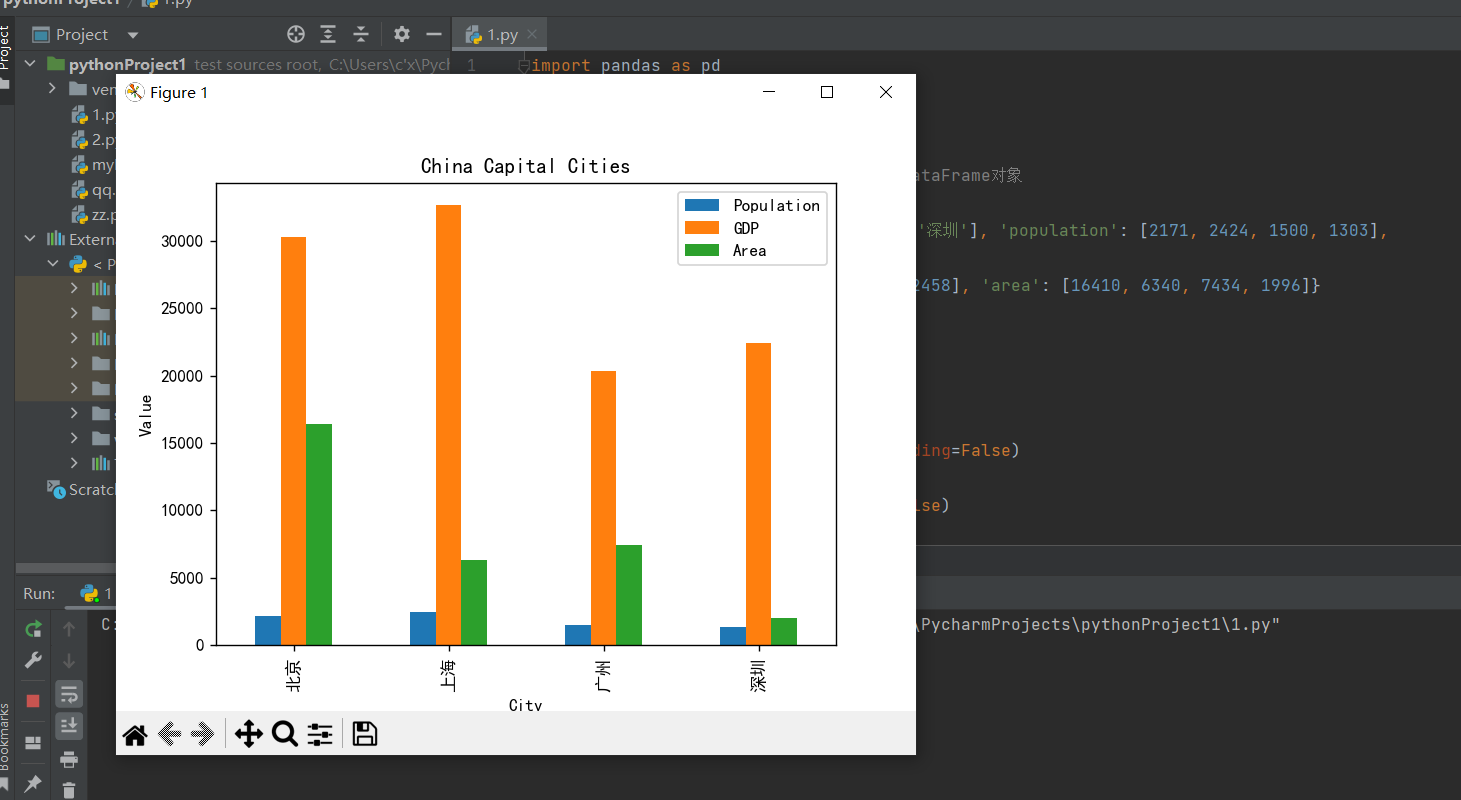
# 定义一个包含省会城市、人口、GDP、城市面积的DataFrame对象
data = {'city': ['北京', '上海', '广州', '深圳'], 'population': [2171, 2424, 1500, 1303],
'gdp': [30320, 32679, 20353, 22458], 'area': [16410, 6340, 7434, 1996]}
df = pd.DataFrame(data)
# 计算各种排名
pop_rank = df['population'].rank(ascending=False)
gdp_rank = df['gdp'].rank(ascending=False)
area_rank = df['area'].rank(ascending=False)
# 将排名添加到DataFrame对象中
df['pop_rank'] = pop_rank
df['gdp_rank'] = gdp_rank
df['area_rank'] = area_rank
# 使用Pandas绘图,可视化实验结果
plt.rcParams['font.sans-serif'] = ['SimHei'] # 设置字体为中文宋体
df.plot(kind='bar', x='city', y=['population', 'gdp', 'area'], title='China Capital Cities')
plt.xlabel('City')
plt.ylabel('Value')
plt.legend(['Population', 'GDP', 'Area'])
plt.show()
# 增加功能:找出人口最多的城市
most_populous_city = df.loc[df['population'].idxmax(), 'city']
print("Most populous city:", most_populous_city)
# 增加功能:计算人口密度
df['population_density'] = df['population'] / df['area']
print("Population density:")
print(df[['city', 'population_density']])
测试Pandas中对于多列数据的处理能力以及数据透视表的应用;