162
社区成员
 发帖
发帖 与我相关
与我相关 我的任务
我的任务
 分享
分享
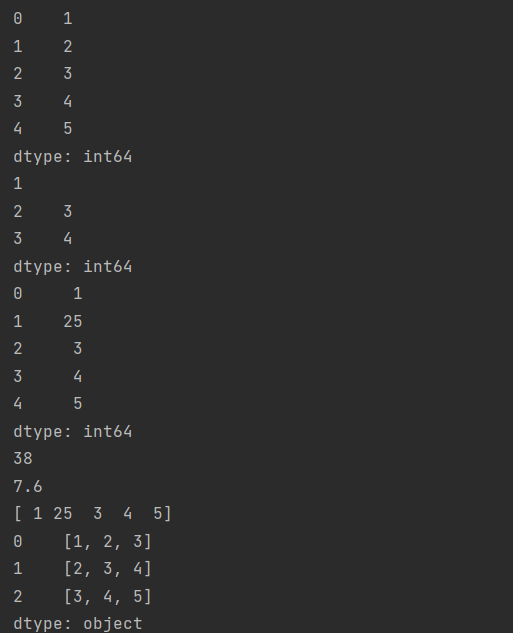
import  pandas as pd
s=pd.Series([1,2,3,4,5])
df=pd.Series({'A':[1,2,3],'B':[2,3,4],'C':[3,4,5]})
print(s)
print(s[0])#索引查找
print(s[2:4])#输出第三到第四个元素(3和4)
# 修改Series对象中的数据
s[1] = 25
# 打印Series对象
print(s)
# 对Series对象进行计算
print(s.sum())  # 求和
print(s.mean())  # 求平均值
print(s.values)#输出值
print(df.mode())#求众数
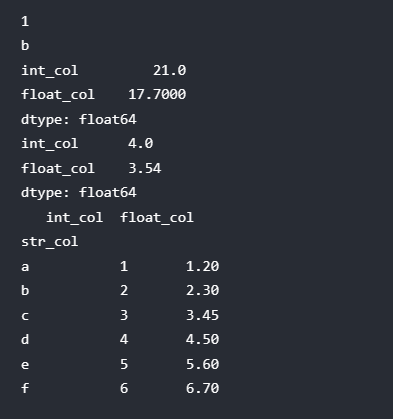
import pandas as pd

# 创建一个DataFrame对象
data = {'int_col': [1, 2, 3, 4, 5], 'float_col': [1.2, 2.3, 3.4, 4.5, 5.6], 'str_col': ['a', 'b', 'c', 'd', 'e']}
df = pd.DataFrame(data)

# 输出第一行第一列的数据
print(df['int_col'][0])  # 1

# 输出第二行第三列的数据
print(df.loc[1, 'str_col'])  # 'b'

# 修改DataFrame对象中的数据
df.loc[2, 'float_col'] = 3.5

# 添加一列新的数据列
df['new_col'] = [10, 20, 30, 40, 50]

# 添加一行新的数据行
df = df.append({'int_col': 6, 'float_col': 6.7, 'str_col': 'f', 'new_col': 60}, ignore_index=True)

# 删除一列数据列
df.drop('new_col', axis=1, inplace=True)

# 对DataFrame对象进行计算
print(df.sum())  # 求和
# print(df.mean())  # 求平均值

# 按照'int_col'字段排序
df_sort = df.sort_values(by='int_col')

# 根据条件对DataFrame进行筛选
df_filter = df[df['int_col'] > 3]

# 使用groupby方法进行分组计算
grouped = df.groupby('str_col')
print(grouped.mean())
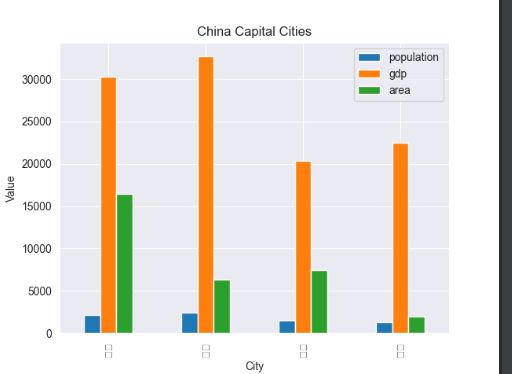
import pandas as pd
import matplotlib.pyplot as plt
import seaborn as sns

# 定义一个包含省会城市、人口、GDP、城市面积的DataFrame对象
data = {'city': ['北京', '上海', '广州', '深圳'], 'population': [2171, 2424, 1500, 1303],
        'gdp': [30320, 32679, 20353, 22458], 'area': [16410, 6340, 7434, 1996]}
df = pd.DataFrame(data)

# 计算各种排名
pop_rank = df['population'].rank(ascending=False)
gdp_rank = df['gdp'].rank(ascending=False)
area_rank = df['area'].rank(ascending=False)

# 将排名添加到DataFrame对象中
df['pop_rank'] = pop_rank
df['gdp_rank'] = gdp_rank
df['area_rank'] = area_rank

# 用 seaborn 库美化图表
sns.set_style('darkgrid')
plt.figure(figsize=(8, 6))

# 使用Pandas绘图,可视化实验结果
ax = df.plot(kind='bar', x='city', y=['population', 'gdp', 'area'], title='China Capital Cities')
ax.set_xlabel('City')
ax.set_ylabel('Value')
plt.show()