162
社区成员
 发帖
发帖 与我相关
与我相关 我的任务
我的任务
 分享
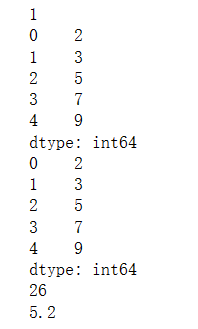
分享代码实现:
import pandas as pd

# 创建一个Series对象
s = pd.Series([1, 3, 5, 7, 9])

# 访问Series对象中的数据
print(s[0])

# 修改Series对象中的数据
s[0] = 2
print(s)

# 打印Series对象
print(s)

# 对Series对象进行计算,如求和、求平均值
print(s.sum())
print(s.mean())
运行结果:
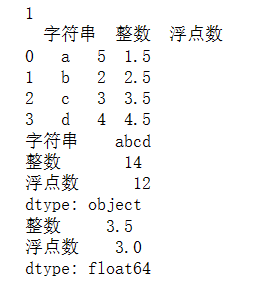
代码实现:
import pandas as pd

# 创建一个DataFrame对象
data = {
    '整数': [1, 2, 3, 4],
    '浮点数': [1.5, 2.5, 3.5, 4.5],
    '字符串': ['a', 'b', 'c', 'd']
}
df = pd.DataFrame(data)

# 访问数据
print(df.loc[0, '整数'])

# 修改数据
df.loc[0, '整数'] = 5
print(df)

# 对DataFrame对象进行求和、求平均值
print(df.sum())
print(df.mean())
运行结果:
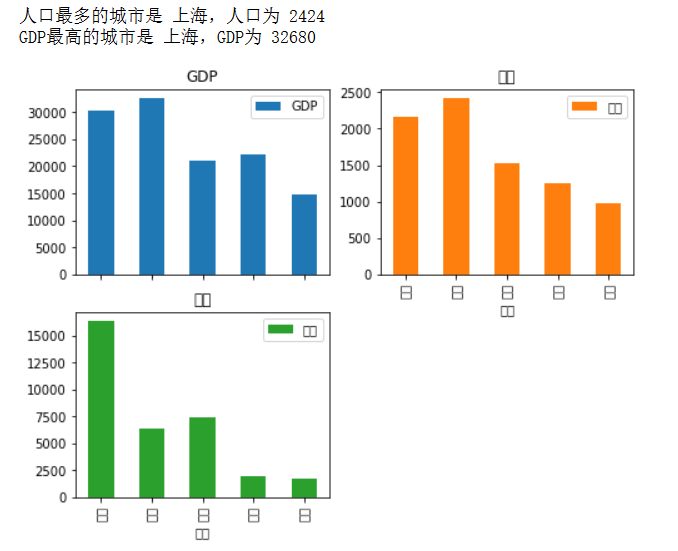
代码实现:
import pandas as pd
import matplotlib.pyplot as plt

# 创建一个DataFrame对象
data = {
    '城市': ['北京', '上海', '广州', '深圳', '杭州'],
    '人口': [2154, 2424, 1523, 1252, 981],
    'GDP': [30320, 32680, 21000, 22300, 14900],
    '面积': [16410, 6340, 7435, 1996, 1689]
}
df = pd.DataFrame(data)

# 计算各种排名
max_population = df['人口'].max()
max_gdp = df['GDP'].max()

city_with_max_population = df.loc[df['人口'] == max_population, '城市'].iloc[0]
city_with_max_gdp = df.loc[df['GDP'] == max_gdp, '城市'].iloc[0]

print(f"人口最多的城市是 {city_with_max_population},人口为 {max_population}")
print(f"GDP最高的城市是 {city_with_max_gdp},GDP为 {max_gdp}")

# 使用Pandas绘图
df.set_index('城市', inplace=True)
df.plot(kind='bar', subplots=True, layout=(2,2), figsize=(8,6))
plt.show()
运行结果: