162
社区成员
 发帖
发帖 与我相关
与我相关 我的任务
我的任务
 分享
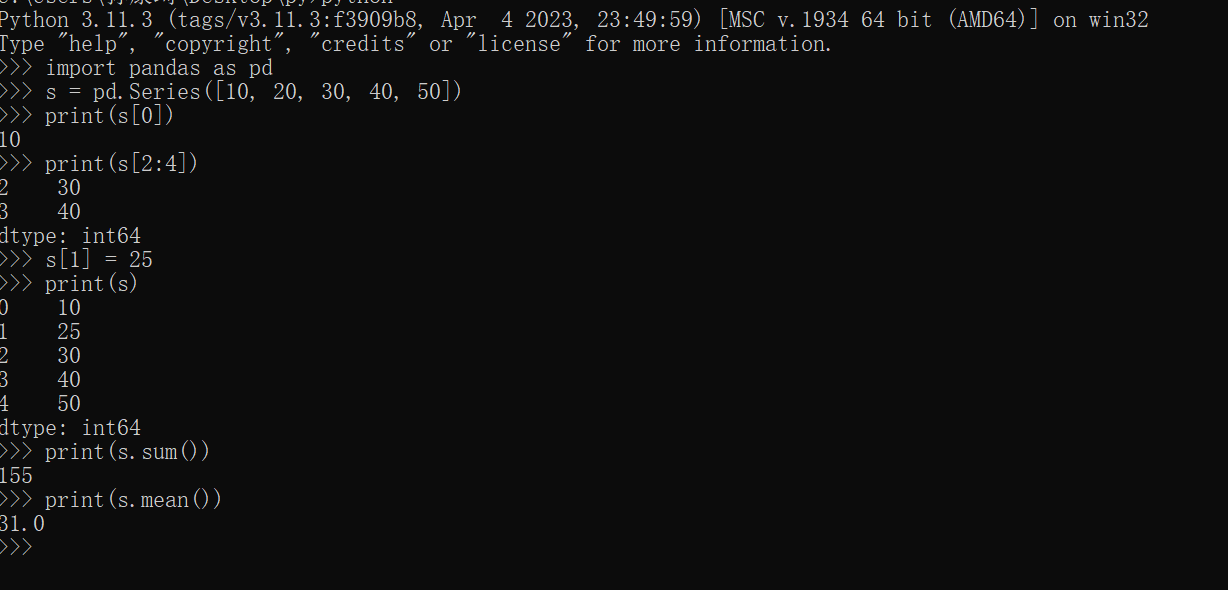
分享import pandas as pd
# 定义一个Series对象
s = pd.Series([10, 20, 30, 40, 50])
# 访问Series对象中的数据
print(s[0]) # 输出第一个元素
print(s[2:4]) # 输出第3个到第4个元素
# 修改Series对象中的数据
s[1] = 25
# 打印Series对象
print(s)
# 对Series对象进行计算
print(s.sum()) # 求和
print(s.mean()) # 求平均值
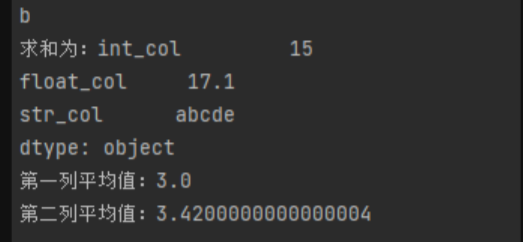
import pandas as pd
# 定义一个DataFrame对象
data = {'int_col': [1, 2, 3, 4, 5], 'float_col': [1.2, 2.3, 3.4, 4.5, 5.6], 'str_col': ['a', 'b', 'c', 'd', 'e']}
df = pd.DataFrame(data)
# 访问DataFrame对象中的数据
print(df['int_col'][0]) # 输出第一行第一列的数据
print(df.loc[1, 'str_col']) # 输出第二行第三列的数据
# 修改DataFrame对象中的数据
df.loc[2, 'float_col'] = 3.5
# 对DataFrame对象进行计算
print(df.sum()) # 求和
print(df.mean()) # 求平均值
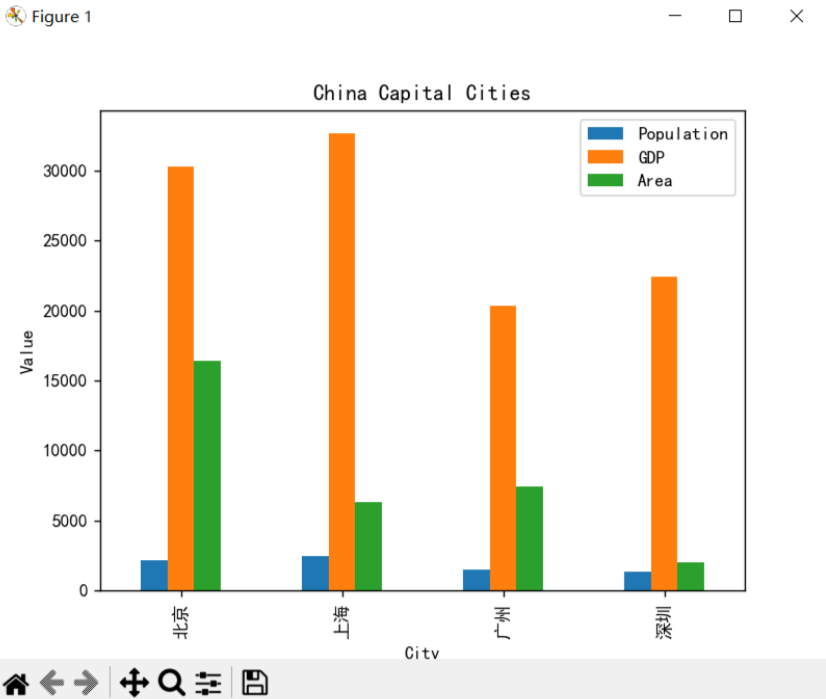
import pandas as pd
import matplotlib.pyplot as plt
# 定义一个包含省会城市、人口、GDP、城市面积的DataFrame对象
data = {'city': ['北京', '上海', '广州', '深圳'], 'population': [2171, 2424, 1500, 1303],
'gdp': [30320, 32679, 20353, 22458], 'area': [16410, 6340, 7434, 1996]}
df = pd.DataFrame(data)
# 计算各种排名
pop_rank = df['population'].rank(ascending=False)
gdp_rank = df['gdp'].rank(ascending=False)
area_rank = df['area'].rank(ascending=False)
# 将排名添加到DataFrame对象中
df['pop_rank'] = pop_rank
df['gdp_rank'] = gdp_rank
df['area_rank'] = area_rank
# 使用Pandas绘图,可视化实验结果
df.plot(kind='bar', x='city', y=['population', 'gdp', 'area'], title='China Capital Cities')
plt.show()