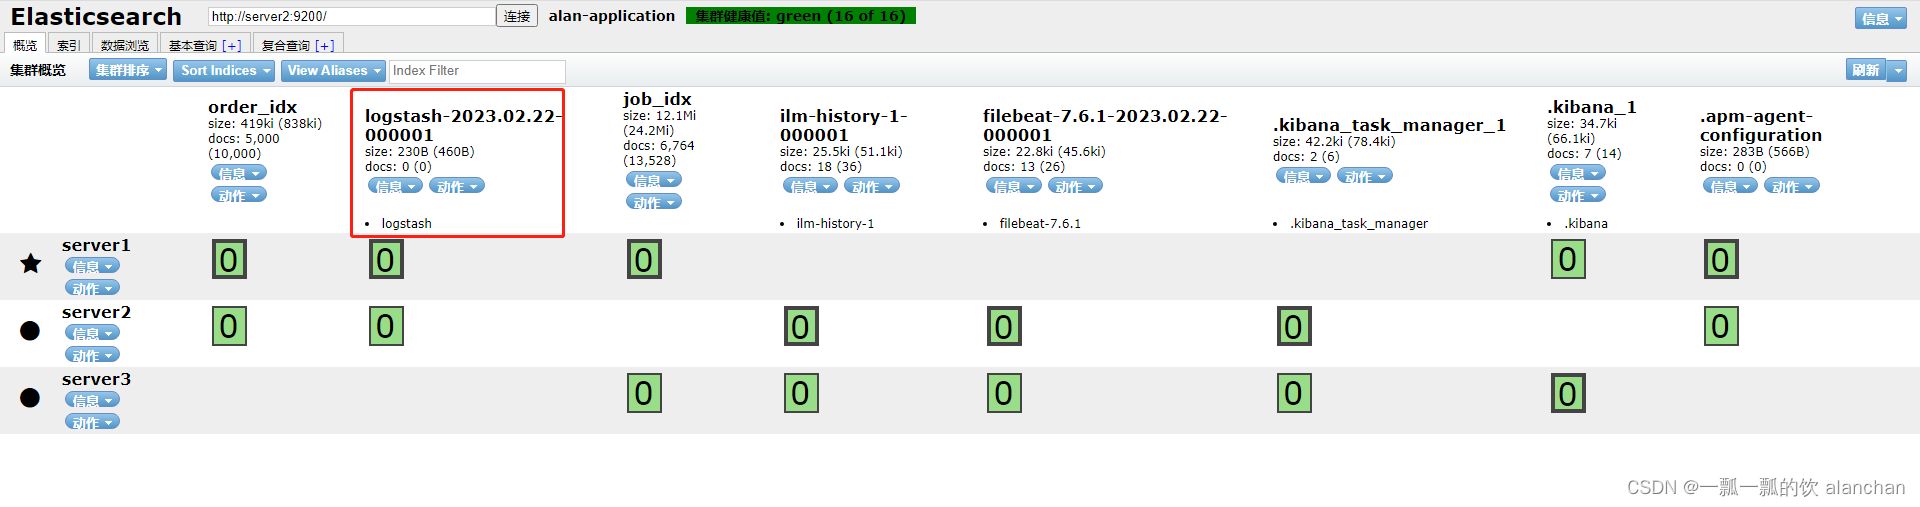
173,773
社区成员
 发帖
发帖 与我相关
与我相关 我的任务
我的任务
 分享
分享1、介绍lucene的功能以及建立索引、搜索单词、搜索词语和搜索句子四个示例实现
2、Elasticsearch7.6.1基本介绍、2种部署方式及验证、head插件安装、分词器安装及验证
3、Elasticsearch7.6.1信息搜索示例(索引操作、数据操作-添加、删除、导入等、数据搜索及分页)
4、Elasticsearch7.6.1 Java api操作ES(CRUD、两种分页方式、高亮显示)和Elasticsearch SQL详细示例
5、Elasticsearch7.6.1 filebeat介绍及收集kafka日志到es示例
6、Elasticsearch7.6.1、logstash、kibana介绍及综合示例(ELK、grok插件)
7、Elasticsearch7.6.1收集nginx日志及监测指标示例
8、Elasticsearch7.6.1收集mysql慢查询日志及监控
9、Elasticsearch7.6.1 ES与HDFS相互转存数据-ES-Hadoop
@
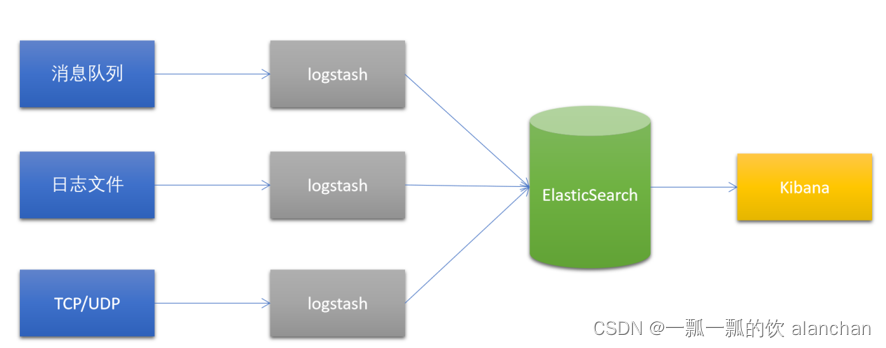
本文简单的介绍了logstash、kibana各自的使用以及最后综合ELK的使用。
本文依赖es的环境好用。
本文分为三部分,即logstash介绍、logstash和kibana部署、使用示例。
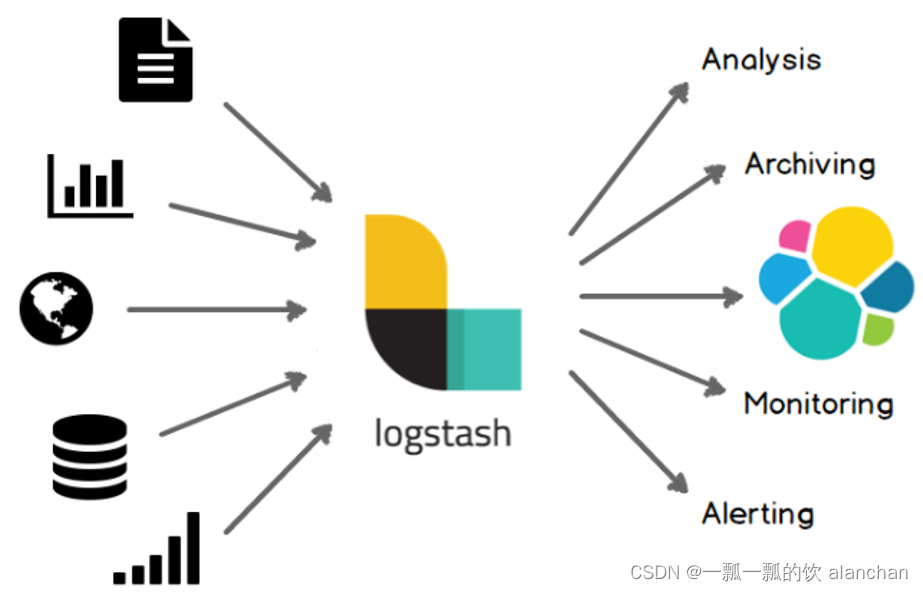
Logstash是一个开源的数据采集引擎。
它可以动态地将不同来源的数据统一采集,并按照指定的数据格式进行处理后,将数据加载到其他的目的地。
最开始,Logstash主要是针对日志采集,但后来Logstash开发了大量丰富的插件,所以,它可以做更多的海量数据的采集。它可以处理各种类型的日志数据,例如:Apache的web log、Java的log4j日志数据,或者是系统、网络、防火墙的日志等等。它也可以很容易的和Elastic Stack的Beats组件整合,也可以很方便的和关系型数据库、NoSQL数据库、Kafka、RabbitMQ等整合。
如果使用beat做数据采集工具的话是可以指定多台logstash的,beat内部有负载均衡机制。
logstash至少到目前为止,都是一个无状态的流处理软件。
logstash通过横向扩展实现集群配置。
下载地址:https://www.elastic.co/cn/downloads/past-releases/logstash-7-6-1
#1、解压Logstash到指定目录
    unzip logstash-7.6.1 -d /usr/local/bigdata

#2、运行
    cd /usr/local/bigdata/logstash-7.6.1/
    bin/logstash -e 'input { stdin { } } output { stdout {} }'
    -e选项表示,直接把配置放在命令中,这样可以有效快速进行测试

    [alanchan@server1 bin]$ logstash -e 'input { stdin { } } output { stdout {} }'
    Sending Logstash logs to /usr/local/bigdata/logstash-7.6.1/logs which is now configured via log4j2.properties
    [2023-02-22T07:01:46,372][INFO ][logstash.setting.writabledirectory] Creating directory {:setting=>"path.queue", :path=>"/usr/local/bigdata/logstash-7.6.1/data/queue"}
    [2023-02-22T07:01:46,551][INFO ][logstash.setting.writabledirectory] Creating directory {:setting=>"path.dead_letter_queue", :path=>"/usr/local/bigdata/logstash-7.6.1/data/dead_letter_queue"}
    [2023-02-22T07:01:47,016][WARN ][logstash.config.source.multilocal] Ignoring the 'pipelines.yml' file because modules or command line options are specified
    [2023-02-22T07:01:47,025][INFO ][logstash.runner          ] Starting Logstash {"logstash.version"=>"7.6.1"}
    [2023-02-22T07:01:47,058][INFO ][logstash.agent           ] No persistent UUID file found. Generating new UUID {:uuid=>"c3df5852-07c3-41a0-b834-a5fe5a217cbb", :path=>"/usr/local/tools/bigdata/logstash-7.6.1/data/uuid"}
    [2023-02-22T07:01:48,702][INFO ][org.reflections.Reflections] Reflections took 41 ms to scan 1 urls, producing 20 keys and 40 values
    [2023-02-22T07:01:50,053][WARN ][org.logstash.instrument.metrics.gauge.LazyDelegatingGauge][main] A gauge metric of an unknown type (org.jruby.RubyArray) has been create for key: cluster_uuids. This may result in invalid serialization.  It is recommended to log an issue to the responsible developer/development team.
    [2023-02-22T07:01:50,069][INFO ][logstash.javapipeline    ][main] Starting pipeline {:pipeline_id=>"main", "pipeline.workers"=>8, "pipeline.batch.size"=>125, "pipeline.batch.delay"=>50, "pipeline.max_inflight"=>1000, "pipeline.sources"=>["config string"], :thread=>"#<Thread:0x334cb465 run>"}
    [2023-02-22T07:01:50,934][INFO ][logstash.javapipeline    ][main] Pipeline started {"pipeline.id"=>"main"}
    The stdin plugin is now waiting for input:
    [2023-02-22T07:01:50,995][INFO ][logstash.agent           ] Pipelines running {:count=>1, :running_pipelines=>[:main], :non_running_pipelines=>[]}
    [2023-02-22T07:01:51,207][INFO ][logstash.agent           ] Successfully started Logstash API endpoint {:port=>9600}

#3、测试
#在当前控制台中输入以下内容,等待Logstash的输出
{
"host"=> "server1",
"message"=> "hello logstash",
"@version"=> "1",
"@timestamp"=> 2022-02-22T14:50:31.007Z
}
#当前控制台输出如下内容:
/usr/local/bigdata/logstash-7.6.1/vendor/bundle/jruby/2.5.0/gems/awesome_print-1.7.0/lib/awesome_print/formatters/base_formatter.rb:31: warning: constant ::Fixnum is deprecated
{
       "message" => "{",
          "host" => "server1",
    "@timestamp" => 2023-02-22T07:04:24.140Z,
      "@version" => "1"
}
{
       "message" => "\"@version\"=> \"1\",",
          "host" => "server1",
    "@timestamp" => 2023-02-22T07:04:24.156Z,
      "@version" => "1"
}
{
       "message" => "\"@timestamp\"=> 2022-02-22T14:50:31.007Z",
          "host" => "server1",
    "@timestamp" => 2023-02-22T07:04:24.156Z,
      "@version" => "1"
}
{
       "message" => "\"message\"=> \"hello logstash\",",
          "host" => "server1",
    "@timestamp" => 2023-02-22T07:04:24.155Z,
      "@version" => "1"
}
{
       "message" => "\"host\"=> \"server1\",",
          "host" => "server1",
    "@timestamp" => 2023-02-22T07:04:24.155Z,
      "@version" => "1"
}
在Linux下安装Kibana,可以使用Elastic stack提供 tar.gz压缩包。
官方下载地址:https://www.elastic.co/cn/downloads/past-releases/kibana-7-6-1
tar -xvzf kibana-7.6.1-linux-x86_64.tar.gz -C /usr/local/bigdata
 cd /usr/local/bigdata/kibana-7.6.1-linux-x86_64/config/

    vim kibana.yml

    # 复制第7行,并修改
    server.host: "server1"
    # 复制第26行,并修改
    server.name: "kibana-server1"
    # 复制第31行,并修改
    elasticsearch.hosts: ["http://server1:9200","http://server2:9200","http://server3:9200"]

    # 修改第118行
    i18n.locale: "zh-CN"
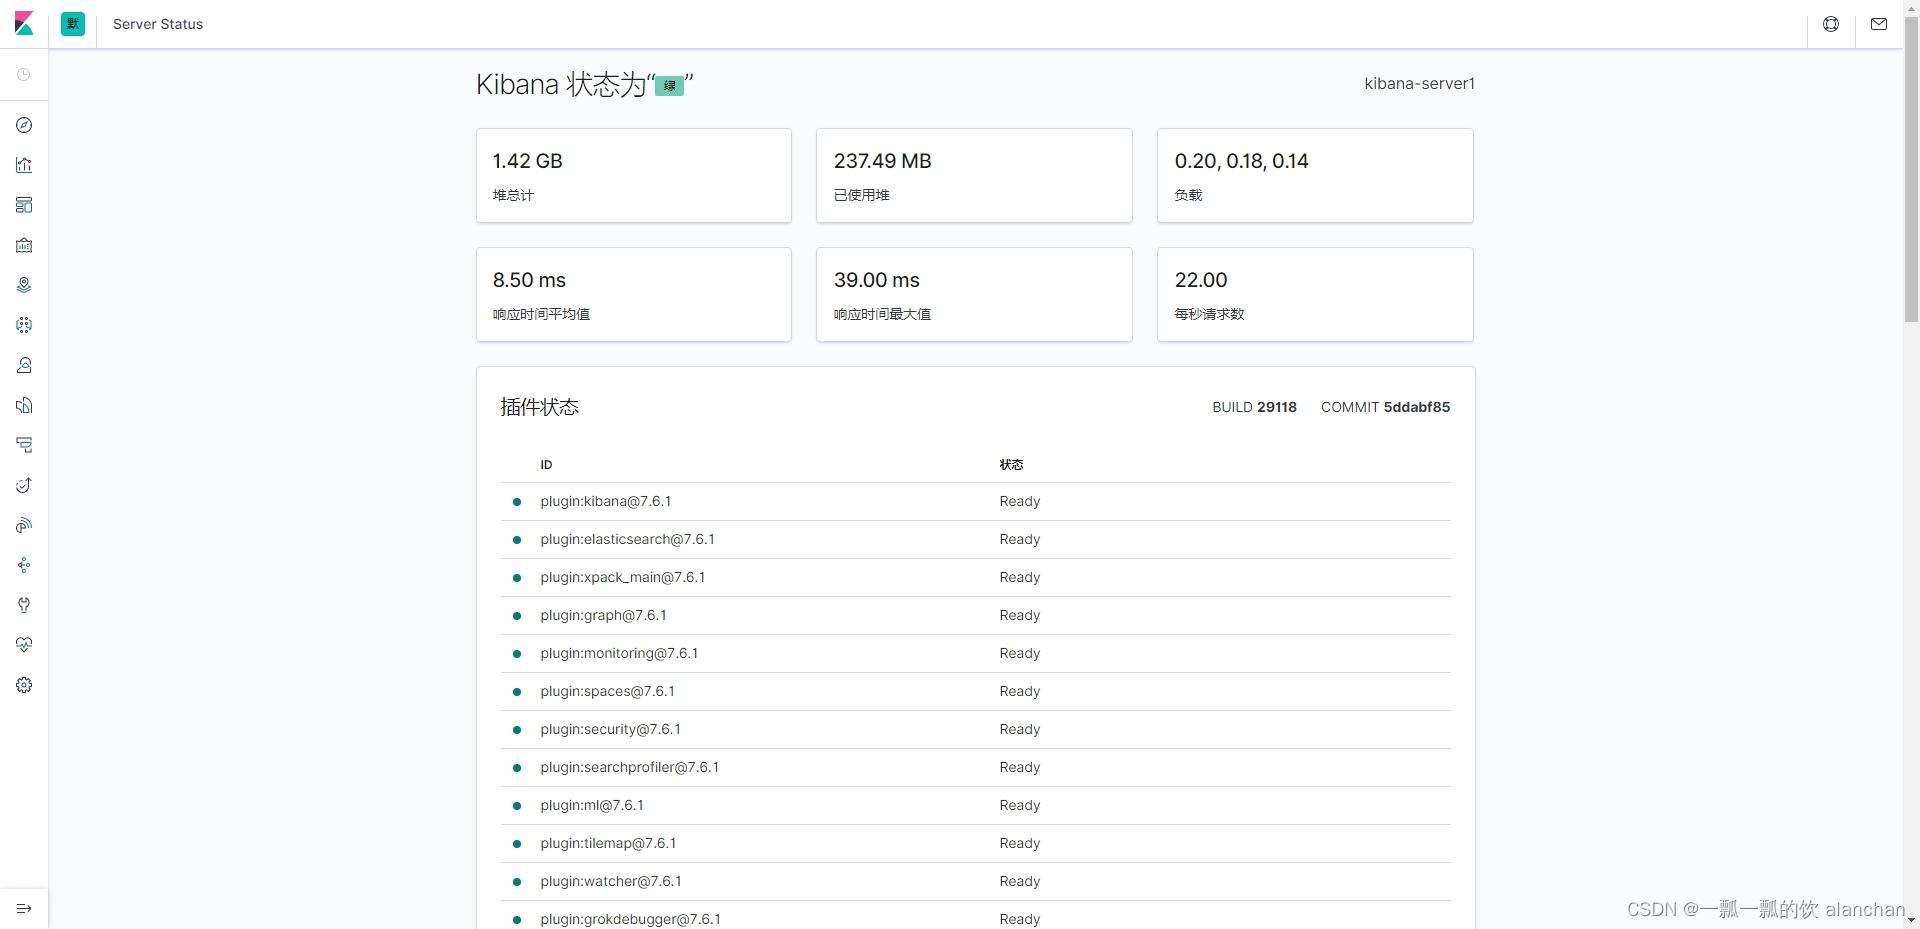
 bin/kibana --allow-root
      .。。。
      log   [07:16:18.948] [info][status][plugin:reporting@7.6.1] Status changed from uninitialized to green - Ready
      log   [07:16:19.012] [info][listening] Server running at http://server1:5601
      log   [07:16:24.231] [info][server][Kibana][http] http server running at http://server1:5601
输入以下网址,可以查看到Kibana的运行状态:http://server1:5601/status
Apache的WebServer会产生大量日志,当想要对这些日志检索分析,就需要先把这些日志导入到Elasticsearch中。此处就可以使用Logstash来实现日志的采集。
打开这个文件,如下图所示。是一个纯文本格式的日志。如下图所示:
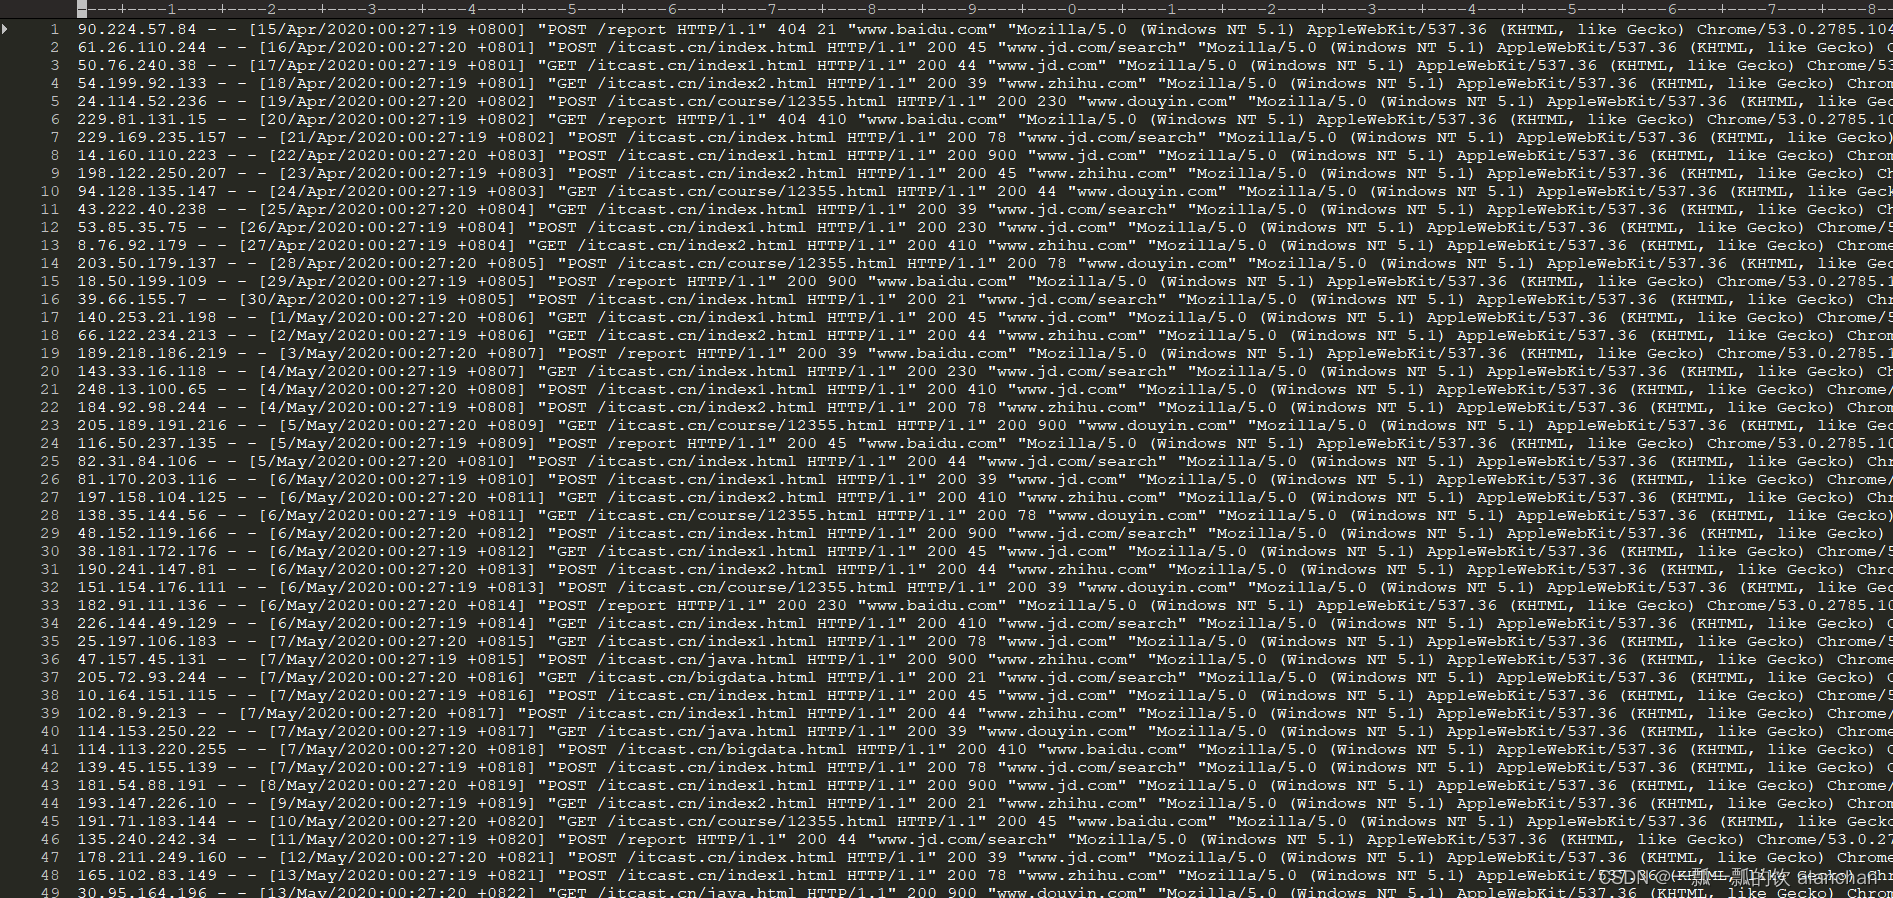

自行找一台机器产生一些数据就好,或按照本文的格式自己模拟造一些数据。
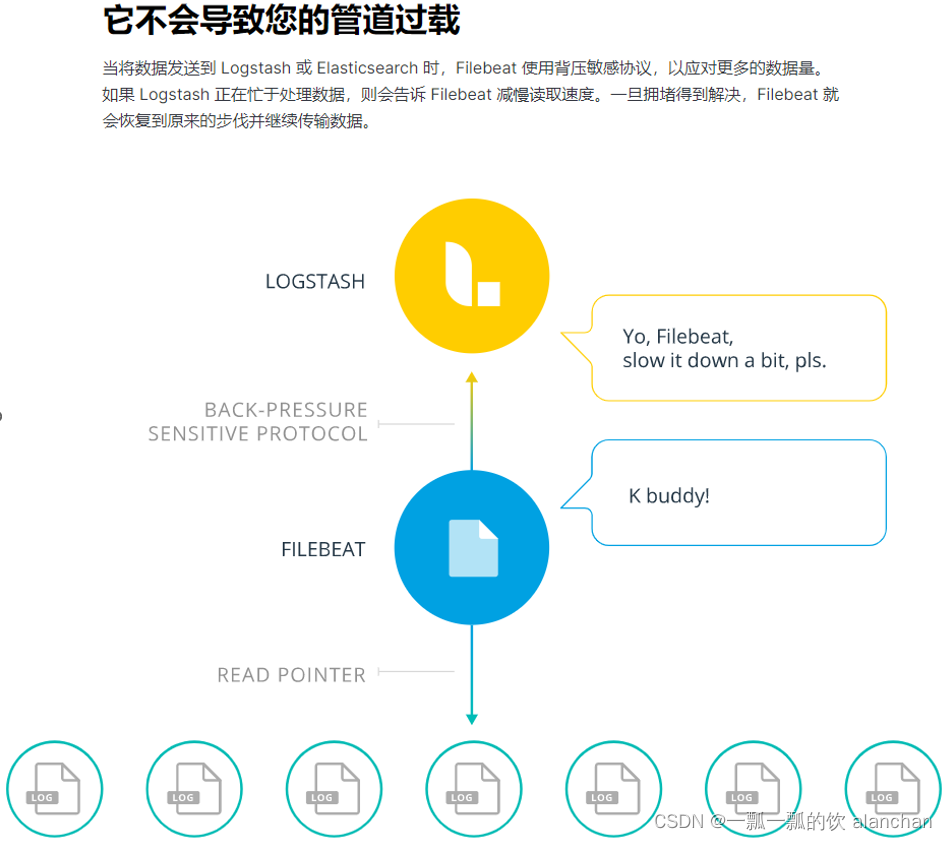
在使用Logstash进行数据解析之前,需要使用FileBeat将采集到的数据发送到Logstash。
之前使用的FileBeat是通过FileBeat的Harvester组件监控日志文件,然后将日志以一定的格式保存到Elasticsearch中,而现在需要配置FileBeats将数据发送到Logstash。
FileBeat这一端配置以下即可:
#-----------------------------Logstash output ---------------------------------
#output.logstash:
  # Boolean flag to enable or disable theoutput module.
  #enabled: true

  # The Logstash hosts  #hosts: ["localhost:5044"]
hosts配置的是Logstash监听的IP地址/机器名以及端口号。
配置FileBeat配置文件
cd /usr/local/bigdata/filebeat-7.6.1-linux-x86_64

touch filebeat-logstash.yml
vim filebeat-logstash.yml
因为Apache的web log日志都是以IP地址开头的,所以我们需要修改下匹配字段
filebeat.inputs:
- type: log
  enabled: true
  paths:
    - /usr/local/bigdata/testdata/log/access.*
  multiline.pattern: '^\\d+\\.\\d+\\.\\d+\\.\\d+ '
  multiline.negate: true
  multiline.match: after

output.logstash:
  enabled: true
  hosts: ["server1:5044"]
启动FileBeat,并指定使用新的配置文件
./filebeat -e -c filebeat-logstash.yml

FileBeat将尝试建立与Logstash监听的IP和端口号进行连接。但此时,我们并没有开启并配置Logstash,所以FileBeat是无法连接到Logstash的
2023-02-22T08:26:13.406Z        ERROR   pipeline/output.go:100  Failed to connect to backoff(async(tcp://server1:5044)): dial tcp 192.168.10.41:5044: connect: connection refused
配置Logstash接收FileBeat数据并打印
Logstash的配置文件和FileBeat类似,它也需要有一个input、和output。
# #号表示添加注释
# input表示要接收的数据
input {
}

# file表示对接收到的数据进行过滤处理
filter {

}

# output表示将数据输出到其他位置
output {

}
cd /usr/local/bigdata/logstash-7.6.1/config
vim filebeat-print.conf
input {
  beats {
    port => 5044
  }
}

output {
  stdout {
    codec => rubydebug
  }
}
bin/logstash -f config/filebeat-print.conf --config.test_and_exit

[alanchan@server1 bin]$ logstash -f config/filebeat-print.conf --config.test_and_exit
Sending Logstash logs to /usr/local/bigdata/logstash-7.6.1/logs which is now configured via log4j2.properties
[2023-02-22T08:19:03,296][INFO ][logstash.setting.writabledirectory] Creating directory {:setting=>"path.queue", :path=>"/usr/local/bigdata/logstash-7.6.1/data/queue"}
[2023-02-22T08:19:03,501][INFO ][logstash.setting.writabledirectory] Creating directory {:setting=>"path.dead_letter_queue", :path=>"/usr/local/bigdata/logstash-7.6.1/data/dead_letter_queue"}
[2023-02-22T08:19:03,953][WARN ][logstash.config.source.multilocal] Ignoring the 'pipelines.yml' file because modules or command line options are specified
[2023-02-22T08:19:04,002][INFO ][logstash.config.source.local.configpathloader] No config files found in path {:path=>"/usr/local/bigdata/logstash-7.6.1/bin/config/filebeat-print.conf"}
[2023-02-22T08:19:04,011][ERROR][logstash.config.sourceloader] No configuration found in the configured sources.
Configuration OK
[2023-02-22T08:19:04,016][INFO ][logstash.runner          ] Using config.test_and_exit mode. Config Validation Result: OK. Exiting Logstash
bin/logstash -f config/filebeat-print.conf --config.reload.automatic
reload.automatic:修改配置文件时自动重新加载
- 启动成功
[alanchan@server1 bin]$ logstash -f ../config/filebeat-print.conf --config.reload.automatic
Sending Logstash logs to /usr/local/bigdata/logstash-7.6.1/logs which is now configured via log4j2.properties
[2023-02-22T08:26:42,821][WARN ][logstash.config.source.multilocal] Ignoring the 'pipelines.yml' file because modules or command line options are specified
[2023-02-22T08:26:42,949][INFO ][logstash.runner          ] Starting Logstash {"logstash.version"=>"7.6.1"}
[2023-02-22T08:26:44,910][INFO ][org.reflections.Reflections] Reflections took 42 ms to scan 1 urls, producing 20 keys and 40 values
[2023-02-22T08:26:46,456][WARN ][org.logstash.instrument.metrics.gauge.LazyDelegatingGauge][main] A gauge metric of an unknown type (org.jruby.RubyArray) has been create for key: cluster_uuids. This may result in invalid serialization.  It is recommended to log an issue to the responsible developer/development team.
[2023-02-22T08:26:46,471][INFO ][logstash.javapipeline    ][main] Starting pipeline {:pipeline_id=>"main", "pipeline.workers"=>8, "pipeline.batch.size"=>125, "pipeline.batch.delay"=>50, "pipeline.max_inflight"=>1000, "pipeline.sources"=>["/usr/local/bigdata/logstash-7.6.1/config/filebeat-print.conf"], :thread=>"#<Thread:0x6b2f523 run>"}
[2023-02-22T08:26:47,320][INFO ][logstash.inputs.beats    ][main] Beats inputs: Starting input listener {:address=>"0.0.0.0:5044"}
[2023-02-22T08:26:47,335][INFO ][logstash.javapipeline    ][main] Pipeline started {"pipeline.id"=>"main"}
[2023-02-22T08:26:47,410][INFO ][logstash.agent           ] Pipelines running {:count=>1, :running_pipelines=>[:main], :non_running_pipelines=>[]}
[2023-02-22T08:26:47,456][INFO ][org.logstash.beats.Server][main] Starting server on port: 5044
[2023-02-22T08:26:47,705][INFO ][logstash.agent           ] Successfully started Logstash API endpoint {:port=>9600}
# 在/usr/local/bigdata/testdata/log创建一个test文件,并写入以下内容
cd /usr/local/bigdata/testdata/log
vim test
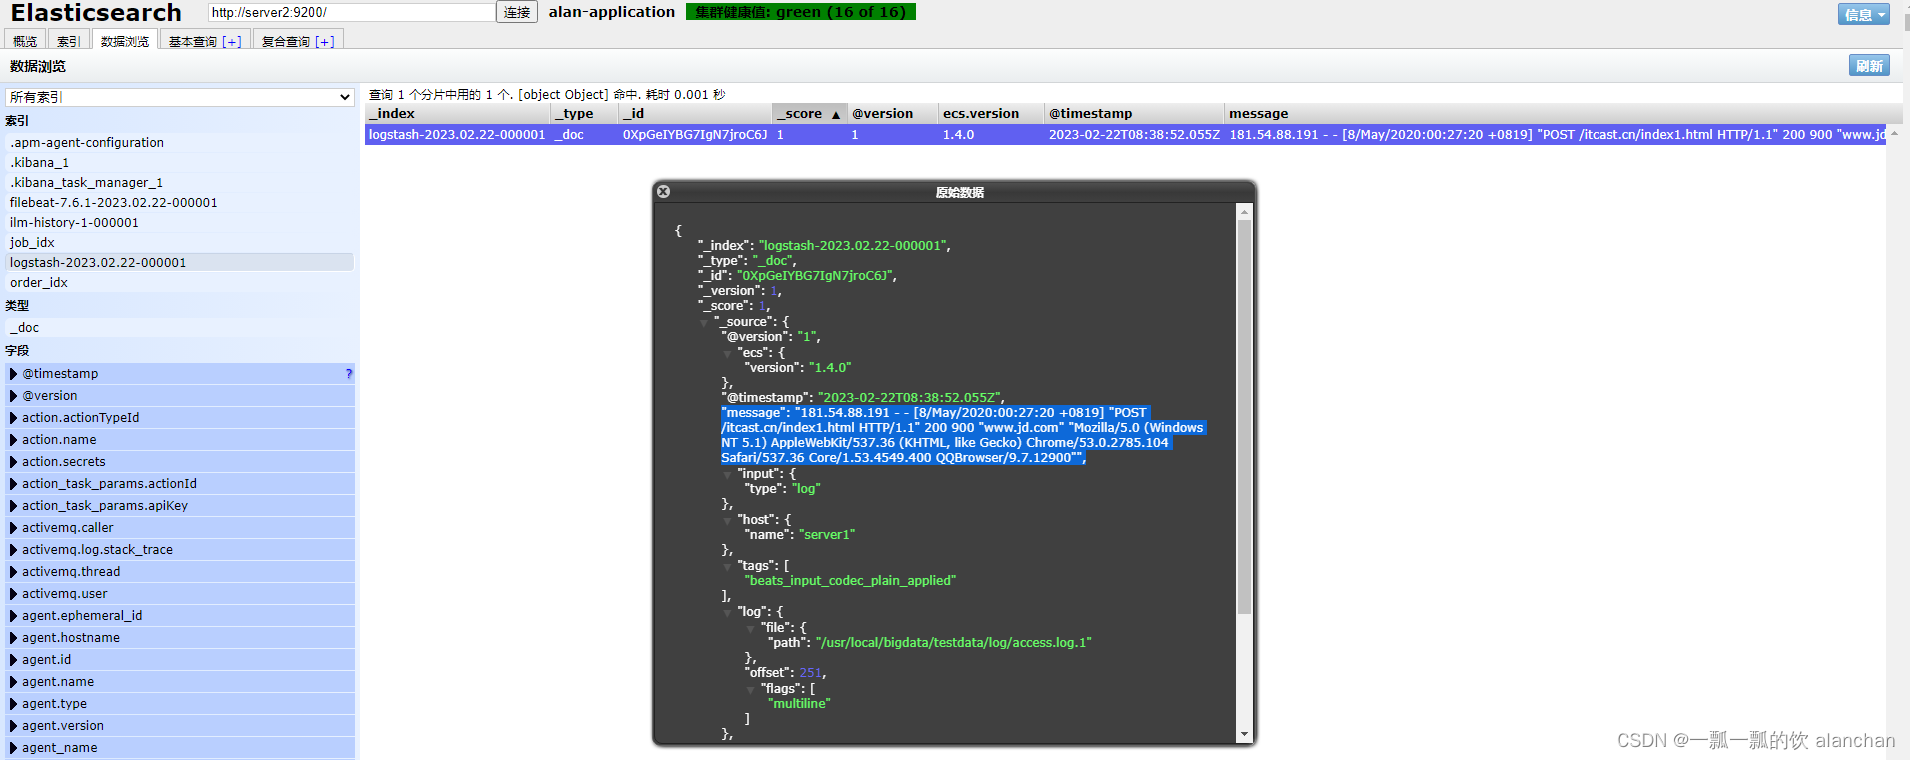
181.54.88.191 - - [8/May/2020:00:27:20 +0819] "POST /itcast.cn/index1.html HTTP/1.1" 200 900 "www.jd.com" "Mozilla/5.0 (Windows NT 5.1) AppleWebKit/537.36 (KHTML, like Gecko) Chrome/53.0.2785.104 Safari/537.36 Core/1.53.4549.400 QQBrowser/9.7.12900"
# 再创建access.log.1文件,使用cat test >> access.log往日志文件中追加内容
touch access.log.1
cat test >> access.log.1
#当我们启动Logstash之后,就可以发现Logstash会打印出来从FileBeat接收到的数据
/usr/local/bigdata/logstash-7.6.1/vendor/bundle/jruby/2.5.0/gems/awesome_print-1.7.0/lib/awesome_print/formatters/base_formatter.rb:31: warning: constant ::Fixnum is deprecated
{
"tags" => [
[0] "beats_input_codec_plain_applied"
],
"agent" => {
"type" => "filebeat",
"ephemeral_id" => "d4e42a6a-817d-4217-b44d-4f1795f08db4",
"hostname" => "server1",
"version" => "7.6.1",
"id" => "72d36c50-e35e-4ac9-b143-83d68cc2b915"
},
"@version" => "1",
"message" => "181.54.88.191 - - [8/May/2020:00:27:20 +0819] \"POST /itcast.cn/index1.html HTTP/1.1\" 200 900 \"www.jd.com\" \"Mozilla/5.0 (Windows NT 5.1) AppleWebKit/537.36 (KHTML, like Gecko) Chrome/53.0.2785.104 Safari/537.36 Core/1.53.4549.400 QQBrowser/9.7.12900\"",
"ecs" => {
"version" => "1.4.0"
},
"input" => {
"type" => "log"
},
"@timestamp" => 2023-02-22T08:23:57.036Z,
"log" => {
"flags" => [
[0] "multiline"
],
"file" => {
"path" => "/usr/local/bigdata/testdata/log/access.log.1"
},
"offset" => 0
},
"host" => {
"name" => "server1"
}
}
通过控制台,发现Logstash input接收到的数据没有经过任何处理就发送给了output组件。而其实我们需要将数据输出到Elasticsearch。所以,修改Logstash的output配置。配置输出Elasticsearch只需要配置以下就可以了:
output {
    elasticsearch {
        hosts => ["localhost:9200" ]
        }
}
  cd /usr/local/bigdata/logstash-7.6.1/config
    touch filebeat-es.conf
vim config/filebeat-es.conf
input {
  beats {
    port => 5044
  }
}

output {
 elasticsearch {
   hosts => ["server1:9200","server2:9200","server3:9200"]
 }
 stdout {
    codec => rubydebug
 }
}
logstash -f config/filebeat-es.conf --config.reload.automatic
追加一条日志到监控的文件中,并查看Elasticsearch中的索引、文档
cat test >> access.log.1
从输出返回结果,我们可以看到,日志确实已经保存到了Elasticsearch中,而且我们看到消息数据是封装在名为message中的,其他的数据也封装在一个个的字段中。我们其实更想要把消息解析成一个个的字段。例如:IP字段、时间、请求方式、请求URL、响应结果。
在Logstash中可以配置过滤器Filter对采集到的数据进行中间处理,在Logstash中,有大量的插件供我们使用。
参考官网:https://www.elastic.co/guide/en/logstash/7.6/filter-plugins.html
cd /usr/local/bigdata/logstash-7.6.1/bin/
logstash-plugin list
Grok是一种将非结构化日志解析为结构化的插件。这个工具非常适合用来解析系统日志、Web服务器日志、MySQL或者是任意其他的日志格式。
Grok官网:https://www.elastic.co/guide/en/logstash/7.6/plugins-filters-grok.html
Grok是通过模式匹配的方式来识别日志中的数据,可以把Grok插件简单理解为升级版本的正则表达式。它拥有更多的模式,默认,Logstash拥有120个模式。如果这些模式不满足我们解析日志的需求,我们可以直接使用正则表达式来进行匹配。
官网:https://github.com/logstash-plugins/logstash-patterns-core/blob/master/patterns/grok-patterns
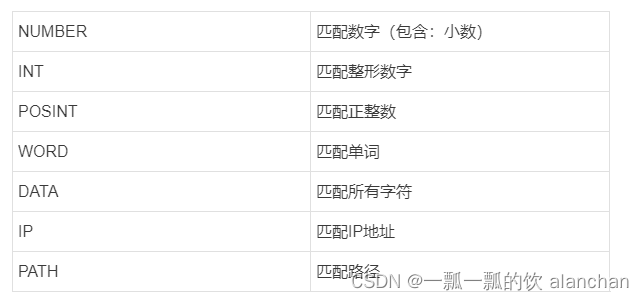
grok模式的语法是:%{SYNTAX:SEMANTIC}SYNTAX指的是Grok模式名称,SEMANTIC是给模式匹配到的文本字段名。例如:
%{NUMBER:duration} %{IP:client}
duration表示:匹配一个数字,client表示匹配一个IP地址。
默认在Grok中,所有匹配到的的数据类型都是字符串,如果要转换成int类型(目前只支持int和float),
可以这样:%{NUMBER:duration:int} %{IP:client}
以下是常用的Grok模式:
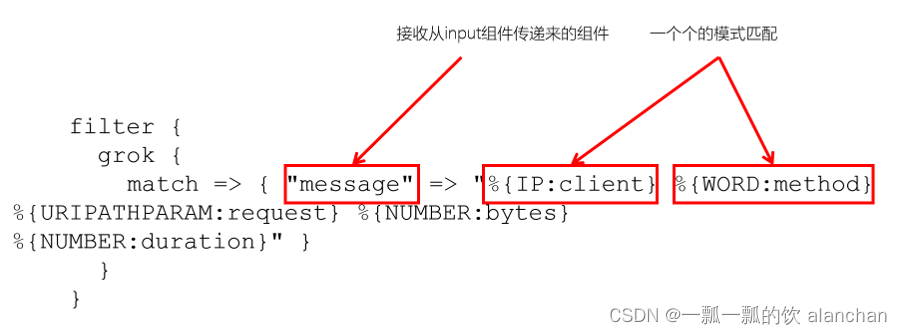
filter {
      grok {
        match => { "message" =>"%{IP:client} %{WORD:method} %{URIPATHPARAM:request} %{NUMBER:bytes}%{NUMBER:duration}" }
      }
 }
181.54.88.191 - - [8/May/2020:00:27:20 +0819] "POST /itcast.cn/index1.html HTTP/1.1" 200 900 "www.jd.com" "Mozilla/5.0 (Windows NT 5.1) AppleWebKit/537.36 (KHTML, like Gecko) Chrome/53.0.2785.104 Safari/537.36 Core/1.53.4549.400 QQBrowser/9.7.12900"
配置Grok过滤插件
#1. 配置Logstash
vim config/filebeat-filter-print.conf

input {
    beats {
        port => 5044
    }
}

filter {
    grok {
        match => {
            "message" =>"%{IP:ip} - - \[%{HTTPDATE:date}\]"
        }
    }
}

output {
    stdout {
        codec => rubydebug
    }
}

#2. 启动Logstash
logstash -f ../config/filebeat-filter-print.conf --config.reload.automatic

#3.验证
cat test >> access.log.1
#logstash输出:
/usr/local/bigdata/logstash-7.6.1/vendor/bundle/jruby/2.5.0/gems/awesome_print-1.7.0/lib/awesome_print/formatters/base_formatter.rb:31: warning: constant ::Fixnum is deprecated
{
            "ip" => "181.54.88.191",
    "@timestamp" => 2023-02-22T08:56:02.077Z,
         "input" => {
        "type" => "log"
    },
           "ecs" => {
        "version" => "1.4.0"
    },
         "agent" => {
                  "id" => "72d36c50-e35e-4ac9-b143-83d68cc2b915",
                "type" => "filebeat",
             "version" => "7.6.1",
            "hostname" => "server1",
        "ephemeral_id" => "d4e42a6a-817d-4217-b44d-4f1795f08db4"
    },
       "message" => "181.54.88.191 - - [8/May/2020:00:27:20 +0819] \"POST /itcast.cn/index1.html HTTP/1.1\" 200 900 \"www.jd.com\" \"Mozilla/5.0 (Windows NT 5.1) AppleWebKit/537.36 (KHTML, like Gecko) Chrome/53.0.2785.104 Safari/537.36 Core/1.53.4549.400 QQBrowser/9.7.12900\"",
           "log" => {
        "offset" => 502,
         "flags" => [
            [0] "multiline"
        ],
          "file" => {
            "path" => "/usr/local/bigdata/testdata/log/access.log.1"
        }
    },
          "tags" => [
        [0] "beats_input_codec_plain_applied"
    ],
          "date" => "8/May/2020:00:27:20 +0819",
          "host" => {
        "name" => "server1"
    },
      "@version" => "1"
}
经过Grok过滤器插件处理之后,已经获取到了ip("ip" => "181.54.88.191")和date( "date" => "8/May/2020:00:27:20 +0819")两个字段。
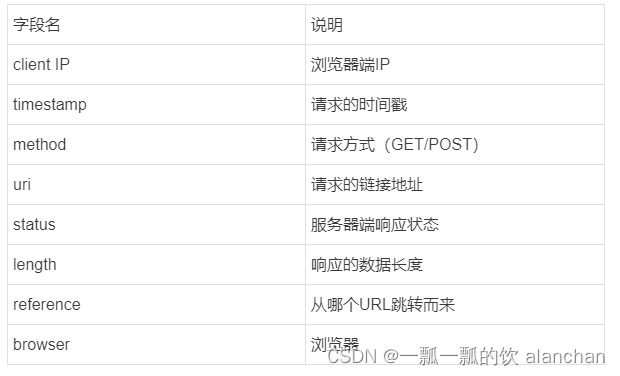
将日志解析成以下字段:
#1、修改filebeat-filter-print.conf过滤条件

input {
  beats {
    port => 5044
  }
}

filter {
    grok {
        match => {
            "message" =>"%{IP:ip} - - \[%{HTTPDATE:date}\] \"%{WORD:method} %{PATH:uri} %{DATA}\" %{INT:status} %{INT:length} \"%{DATA:reference}\" \"%{DATA:browser}\""
        }
    }
}

output {
 stdout {
    codec => rubydebug
 }
}

#2、重启logstash
logstash -f ../config/filebeat-filter-print.conf --config.reload.automatic

#3、造数据
[alanchan@server1 bin]$ cd /usr/local/bigdata/testdata/log
[alanchan@server1 log]$ cat test >> access.log.1

#4、查看结果
/usr/local/bigdata/logstash-7.6.1/vendor/bundle/jruby/2.5.0/gems/awesome_print-1.7.0/lib/awesome_print/formatters/base_formatter.rb:31: warning: constant ::Fixnum is deprecated
{
    "host" => {
        "name" => "server1"
        },
    "uri" => "/itcast.cn/index1.html",
    "input" => {
        "type" => "log"
        },
    "length" => "900",
    "browser" => "Mozilla/5.0 (Windows NT 5.1) AppleWebKit/537.36 (KHTML, like Gecko) Chrome/53.0.2785.104 Safari/537.36 Core/1.53.4549.400 QQBrowser/9.7.12900",
    "@timestamp" => 2023 - 02 - 22 T09: 14: 12.101 Z,
    "@version" => "1",
    "date" => "8/May/2020:00:27:20 +0819",
    "method" => "POST",
    "log" => {
        "flags" => [
            [0]
            "multiline"
            ],
        "offset" => 753,
        "file" => {
            "path" => "/usr/local/bigdata/testdata/log/access.log.1"
            }
        },
    "ip" => "181.54.88.191",
    "status" => "200",
    "reference" => "www.jd.com",
    "agent" => {
        "type" => "filebeat",
        "ephemeral_id" => "d4e42a6a-817d-4217-b44d-4f1795f08db4",
        "hostname" => "server1",
        "id" => "72d36c50-e35e-4ac9-b143-83d68cc2b915",
        "version" => "7.6.1"
        },
    "ecs" => {
        "version" => "1.4.0"
        },
    "tags" => [
            [0]
            "beats_input_codec_plain_applied"
        ],
    "message" => "181.54.88.191 - - [8/May/2020:00:27:20 +0819] \"POST /itcast.cn/index1.html HTTP/1.1\" 200 900 \"www.jd.com\" \"Mozilla/5.0 (Windows NT 5.1) AppleWebKit/537.36 (KHTML, like Gecko) Chrome/53.0.2785.104 Safari/537.36 Core/1.53.4549.400 QQBrowser/9.7.12900\""
}
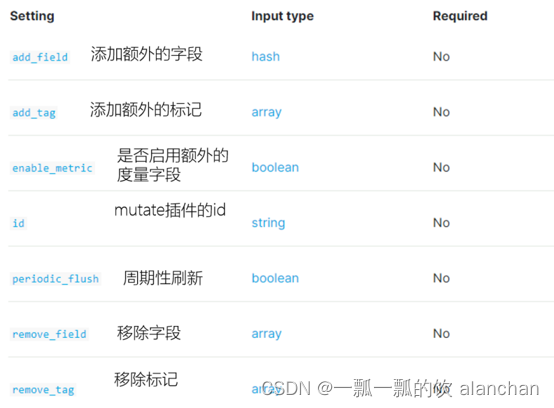
到目前为止已经通过了Grok Filter可以将日志消息解析成一个一个的字段,那现在需要将这些字段保存到Elasticsearch中。看到了Logstash的输出中,有大量的字段,但如果只需要保存我们需要的8个,该如何处理呢?而且,如果需要将日期的格式进行转换,又该如何处理呢?
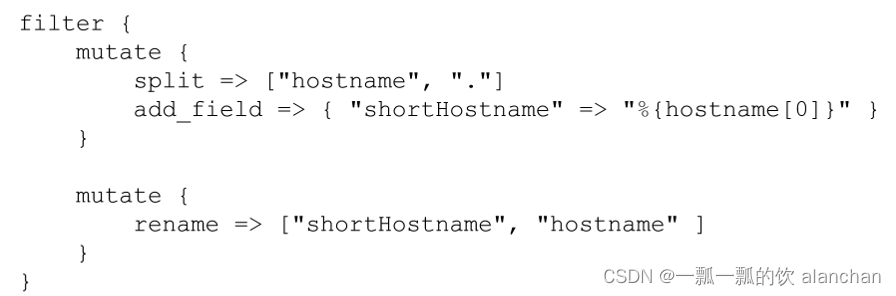
input {
  beats {
    port => 5044
  }
}

filter {
    grok {
        match => {
            "message" =>"%{IP:ip} - - \[%{HTTPDATE:date}\] \"%{WORD:method} %{PATH:uri} %{DATA}\" %{INT:status} %{INT:length} \"%{DATA:reference}\" \"%{DATA:browser}\""
        }
    }
    mutate {
        enable_metric => "false"
        remove_field => ["message", "log", "tags", "@timestamp", "input", "agent", "host", "ecs", "@version"]
    }
}

output {
 stdout {
    codec => rubydebug
 }
}
转换日期格式
要将日期格式进行转换,我们可以使用Date插件来实现。该插件专门用来解析字段中的日期,
官方说明文档:https://www.elastic.co/guide/en/logstash/7.6/plugins-filters-date.html
用法如下
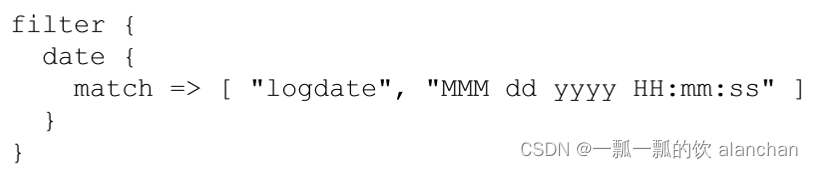
Logstash配置修改为如下
input {
  beats {
    port => 5044
  }
}

filter {
    grok {
        match => {
            "message" =>"%{IP:ip} - - \[%{HTTPDATE:date}\] \"%{WORD:method} %{PATH:uri} %{DATA}\" %{INT:status} %{INT:length} \"%{DATA:reference}\" \"%{DATA:browser}\""
        }
    }
    mutate {
        enable_metric => "false"
        remove_field => ["message", "log", "tags", "@timestamp", "input", "agent", "host", "ecs", "@version"]
    }
   date {
        match => ["date","dd/MMM/yyyy:HH:mm:ss Z","yyyy-MM-dd HH:mm:ss"]
        target => "date"
    }
}

output {
 stdout {
    codec => rubydebug
 }
}
elasticsearch {
        hosts =>["server1:9200" ,"server2:9200","server3:9200"]
        index => "xxx"
}
index来指定索引名称,默认输出的index名称为:logstash-%{+yyyy.MM.dd}。但注意,要在index中使用时间格式化,filter的输出必须包含 @timestamp字段,否则将无法解析日期。
#1、vim filebeat-filter-print.conf

input {
  beats {
    port => 5044
  }
}

filter {
    grok {
        match => {
            "message" => "%{IP:ip} - - \[%{HTTPDATE:date}\] \"%{WORD:method} %{PATH:uri} %{DATA}\" %{INT:status:int} %{INT:length:int} \"%{DATA:reference}\" \"%{DATA:browser}\""
        }
    }
    mutate {
        enable_metric => "false"
        remove_field => ["message", "log", "tags", "input", "agent", "host", "ecs", "@version"]
    }
    date {
        match => ["date","dd/MMM/yyyy:HH:mm:ss Z","yyyy-MM-dd HH:mm:ss"]
        target => "date"
    }
}


output {
    stdout {
        codec => rubydebug
    }

    elasticsearch {
        hosts => ["server1:9200" ,"server2:9200" ,"server3:9200"]
        index => "apache_web_log_%{+YYYY-MM}"
    }
}


#index名称中,不能出现大写字符

#2、重启logstash
    logstash -f ../config/filebeat-filter-print.conf --config.reload.automatic

#3、造数据
[alanchan@server1 bin]$ cd /usr/local/bigdata/testdata/log
[alanchan@server1 log]$ cat test >> access.log.1

#4、验证
/usr/local/bigdata/logstash-7.6.1/vendor/bundle/jruby/2.5.0/gems/awesome_print-1.7.0/lib/awesome_print/formatters/base_formatter.rb:31: warning: constant ::Fixnum is deprecated
{
       "status" => "200",
       "length" => "900",
           "ip" => "181.54.88.191",
    "reference" => "www.jd.com",
      "browser" => "Mozilla/5.0 (Windows NT 5.1) AppleWebKit/537.36 (KHTML, like Gecko) Chrome/53.0.2785.104 Safari/537.36 Core/1.53.4549.400 QQBrowser/9.7.12900",
       "method" => "POST",
         "date" => 2020-05-07T16:08:20.000Z,
          "uri" => "/itcast.cn/index1.html"
}
Kibana可以用来展示丰富的图表。
Kibana是一个开源的数据分析和可视化平台,使用Kibana可以用来搜索Elasticsearch中的数据,构建漂亮的可视化图形、以及制作一些好看的仪表盘
Kibana是用来管理Elastic stack组件的可视化平台。例如:使用Kibana可以进行一些安全设置、用户角色设置、对Elasticsearch进行快照等等
Kibana提供统一的访问入口,不管是日志分析、还是查找文档,Kibana提供了一个使用这些功能的统一访问入口
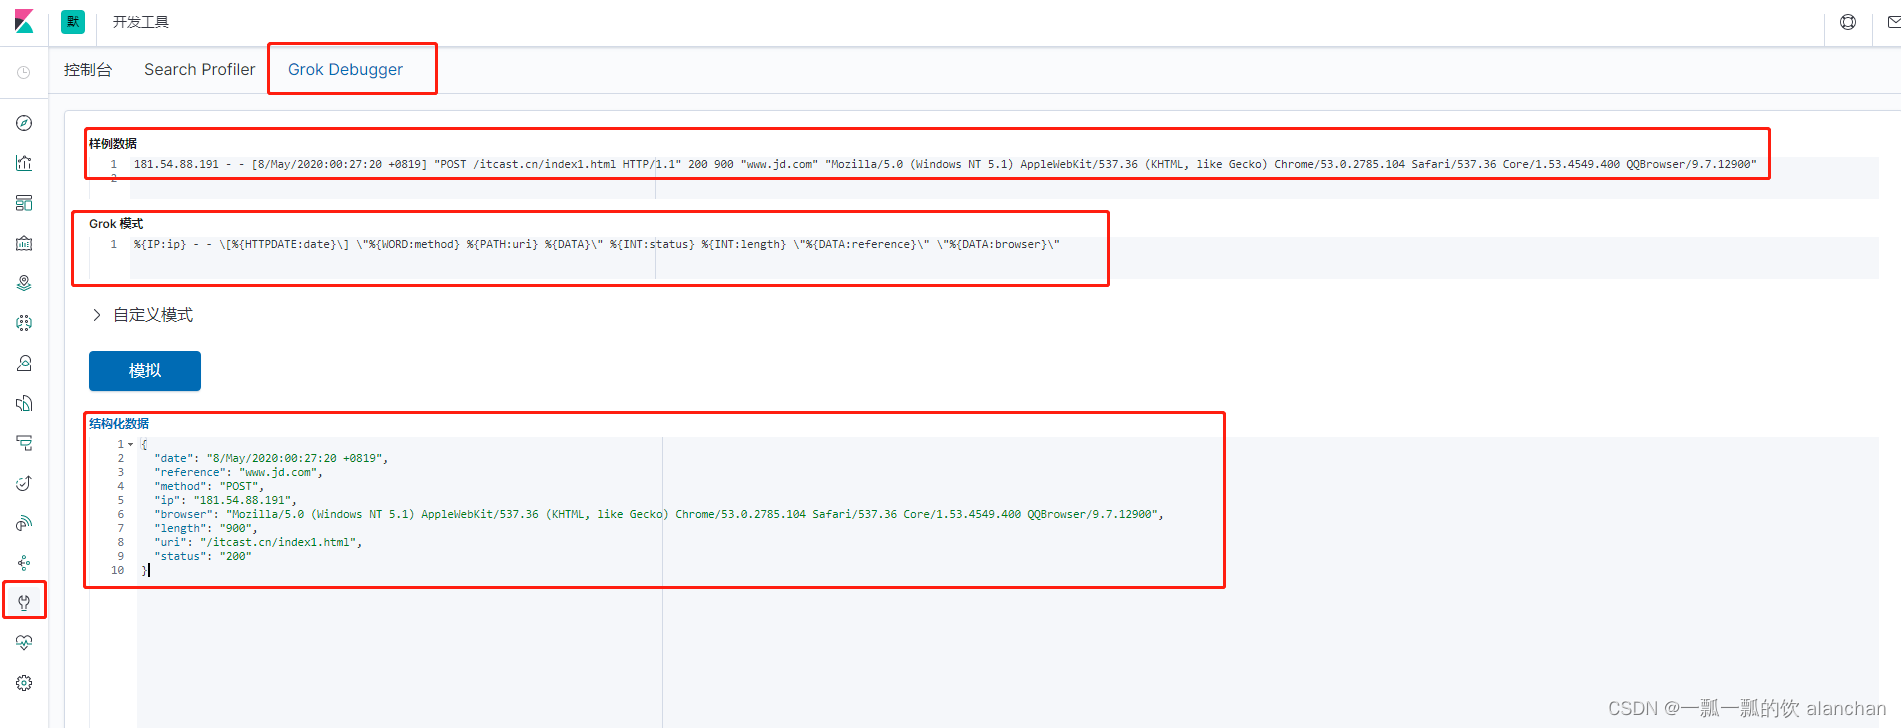
Kibana使用的是Elasticsearch数据源,Elasticsearch是存储和处理数据的引擎,而Kibana就是基于Elasticsearch之上的可视化平台Kibana还提供了一些开发的工具,例如:Grok插件的调试工具
主要功能:
1、探索和查询Elasticsearch中的数据
2、可视化与分析
3、调试功能
详见本文第一部分
http://server1:5601/status
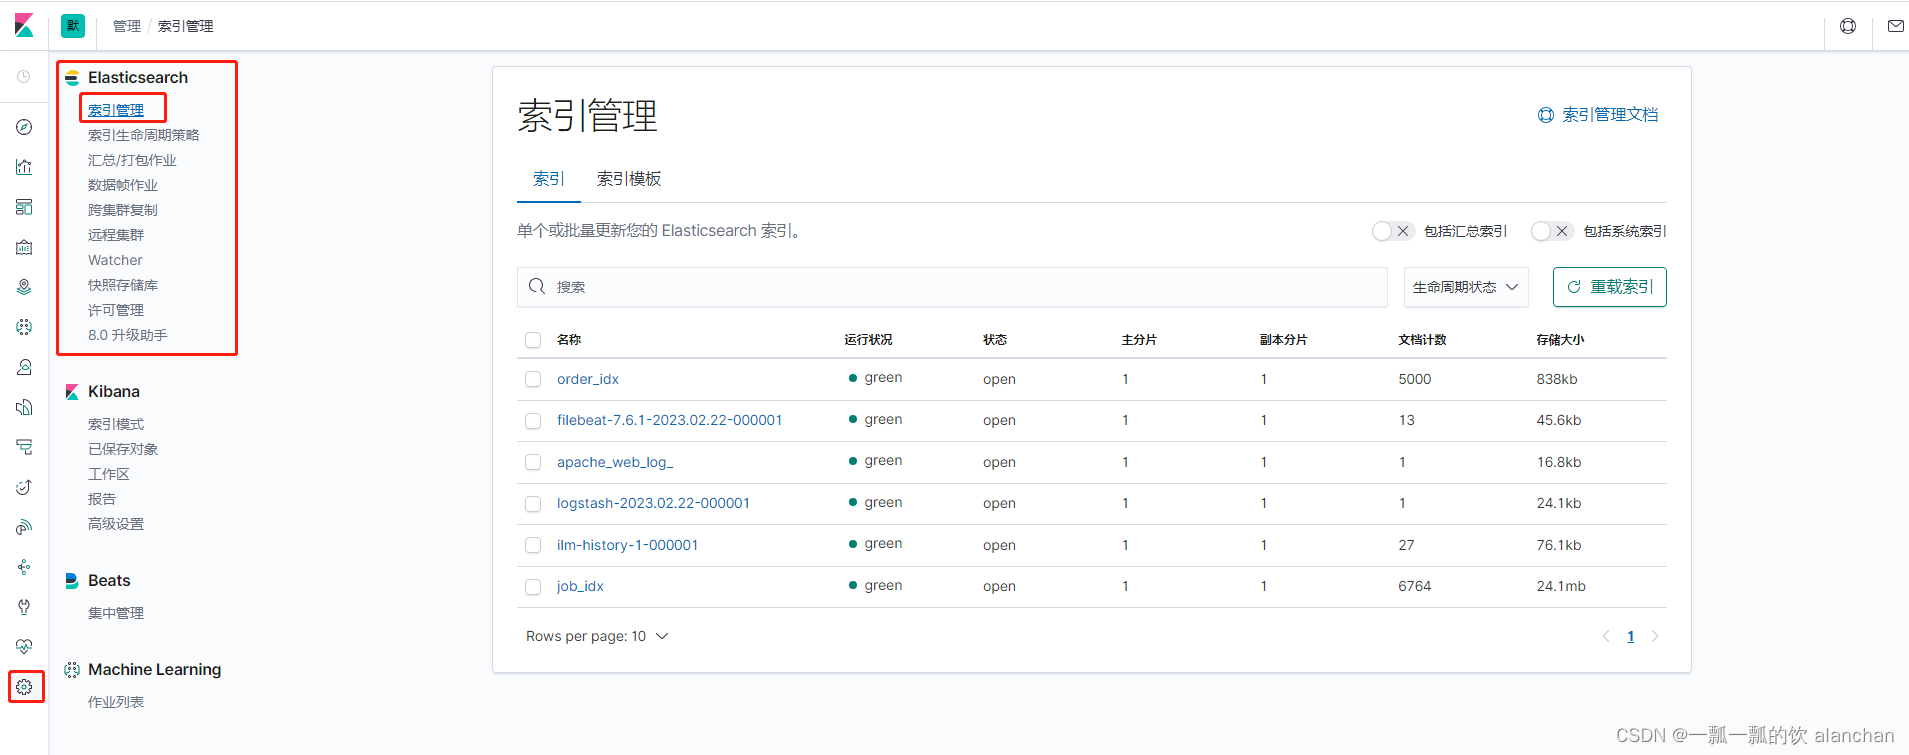
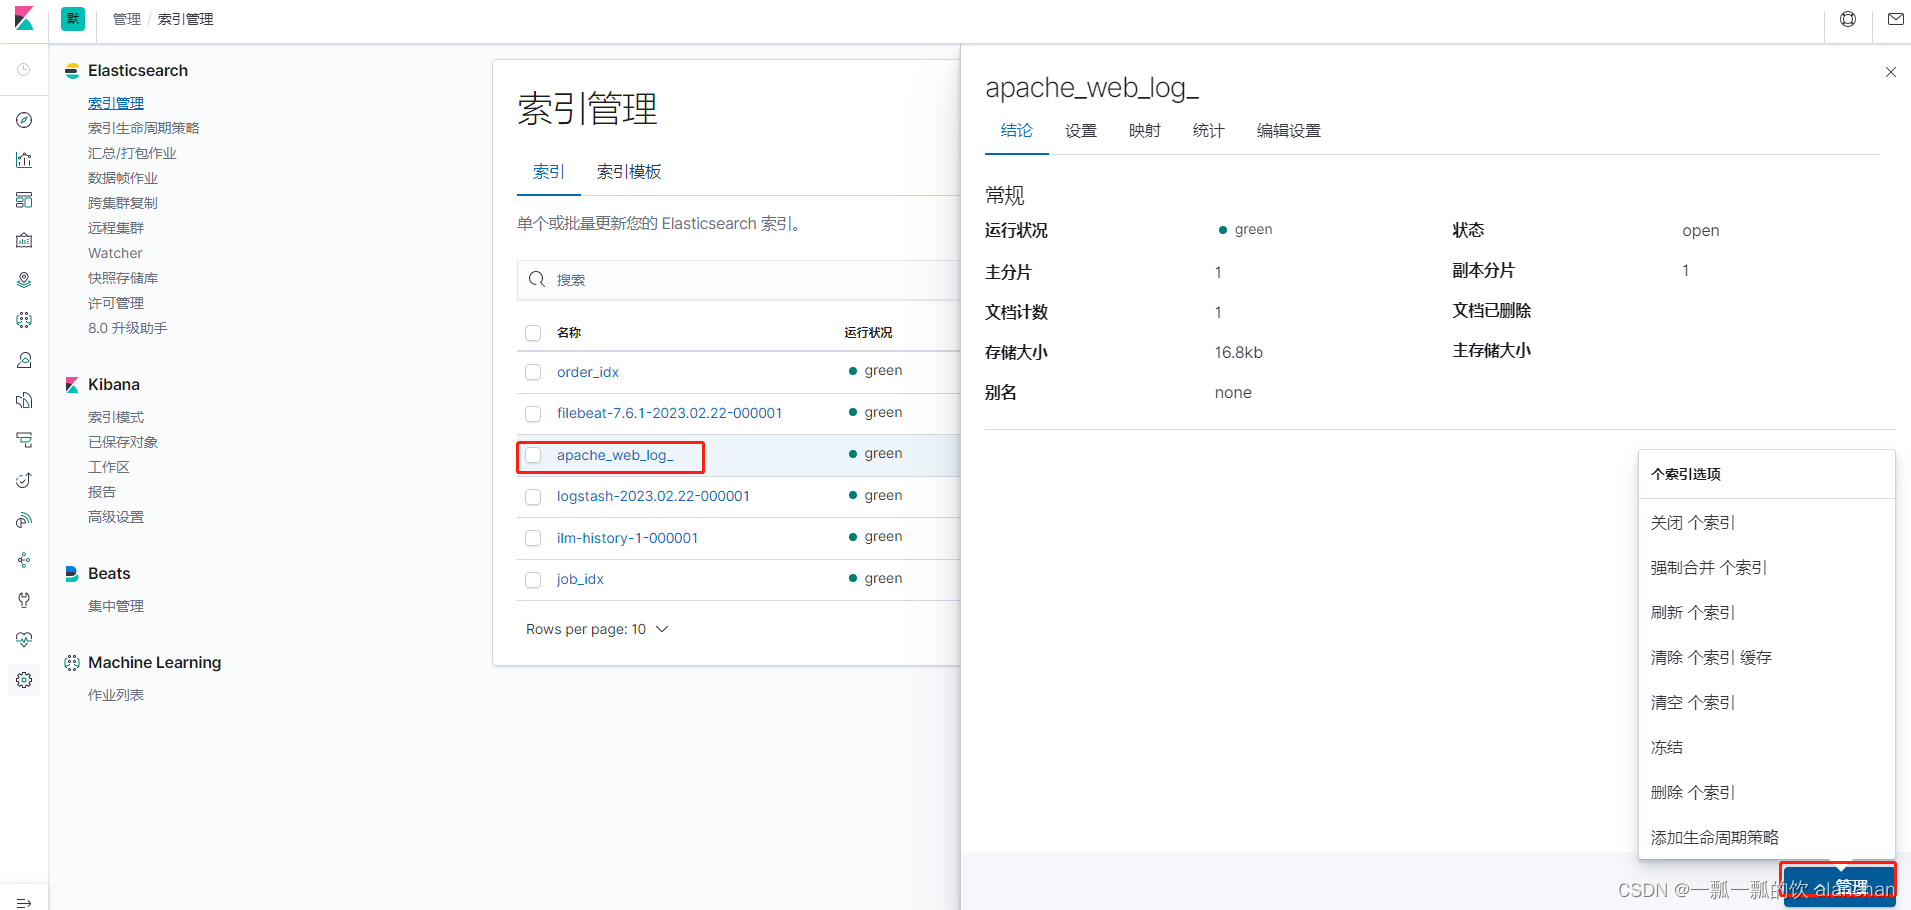
点击按钮,再点击「Index Management」,可以查看到Elasticsearch集群中的索引状态。
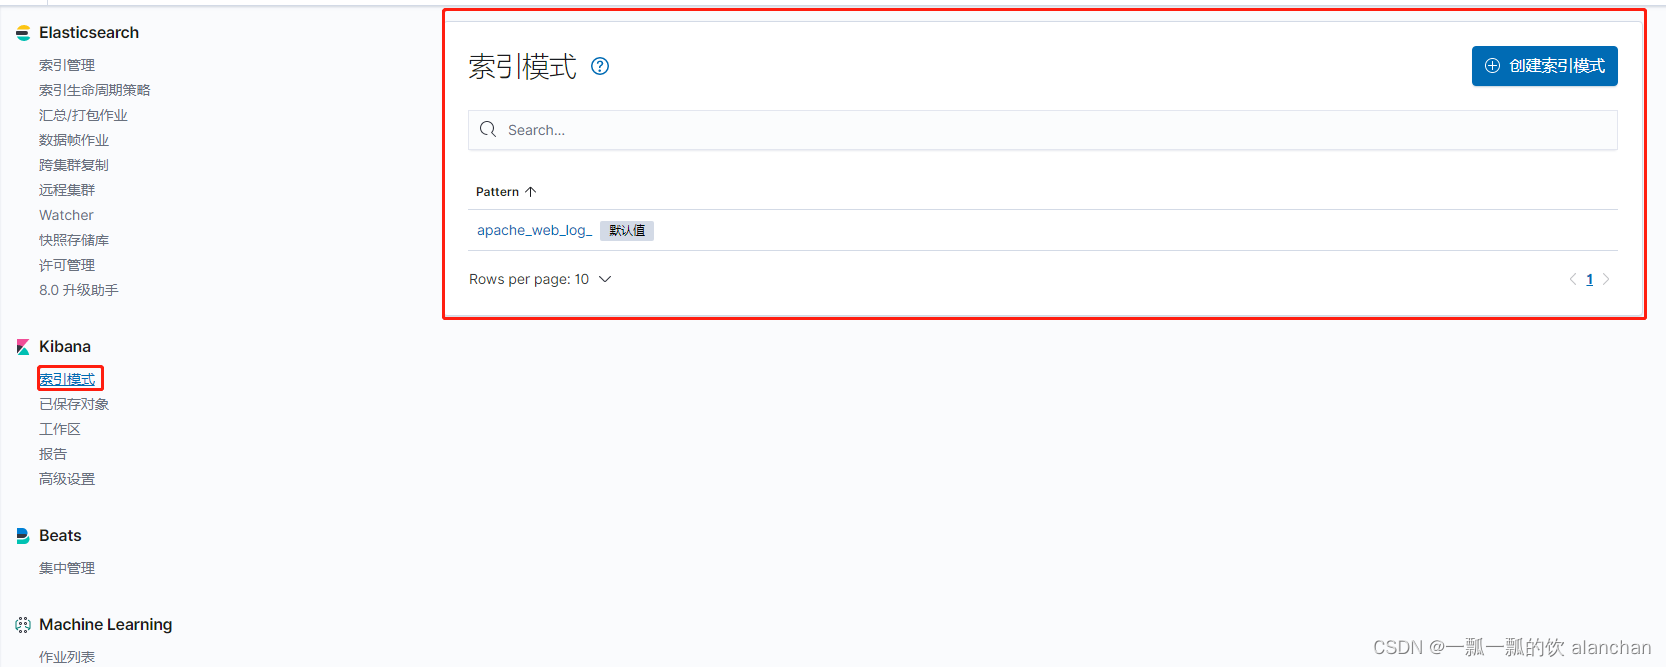
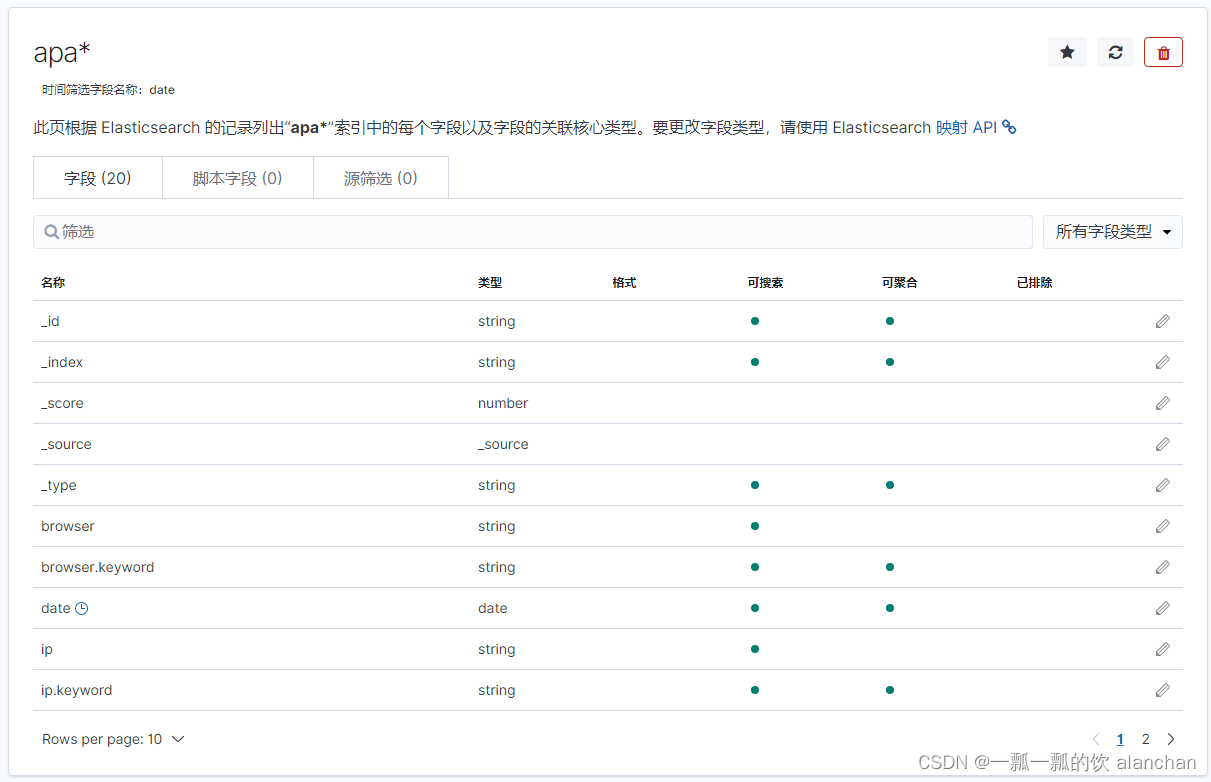
在开始使用Kibana之前,我们需要指定想要对哪些Elasticsearch索引进行处理、分析。
在Kibana中,可以通过定义索引模式(Index Patterns)来对应匹配Elasticsearch索引。在第一次访问Kibana的时候,系统会提示我们定义一个索引模式。或者我们可以通过点击按钮,再点击Kibana下方的Index Patterns,来创建索引模式。
参考下图
用于匹配哪些Elasticsearch中的索引。点击「Next step」
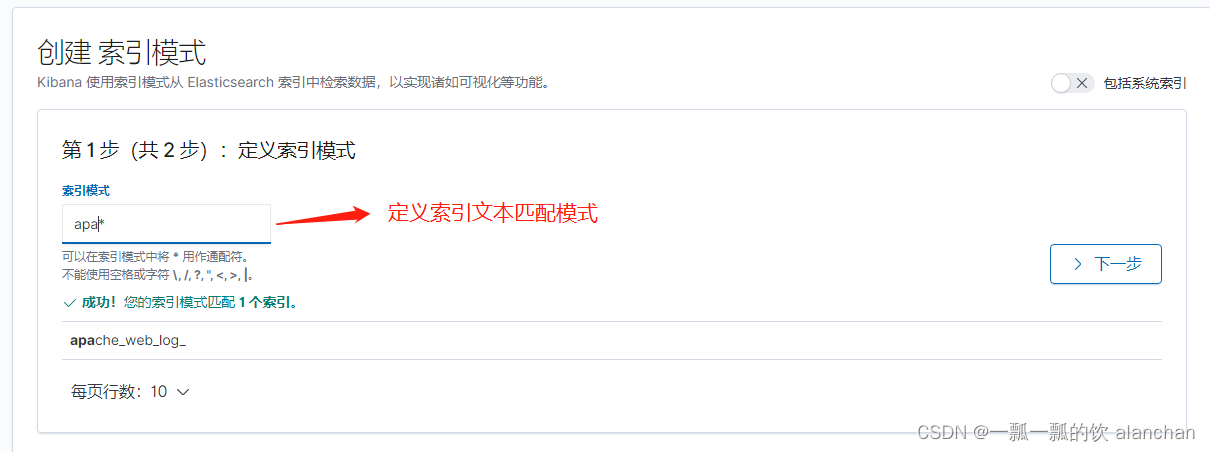

点击「Create Index Pattern」按钮,创建索引模式。创建索引模式成功后,可以看到显示了该索引模式对应的字段。里面描述了哪些可以用于搜索、哪些可以用来进行聚合计算等。
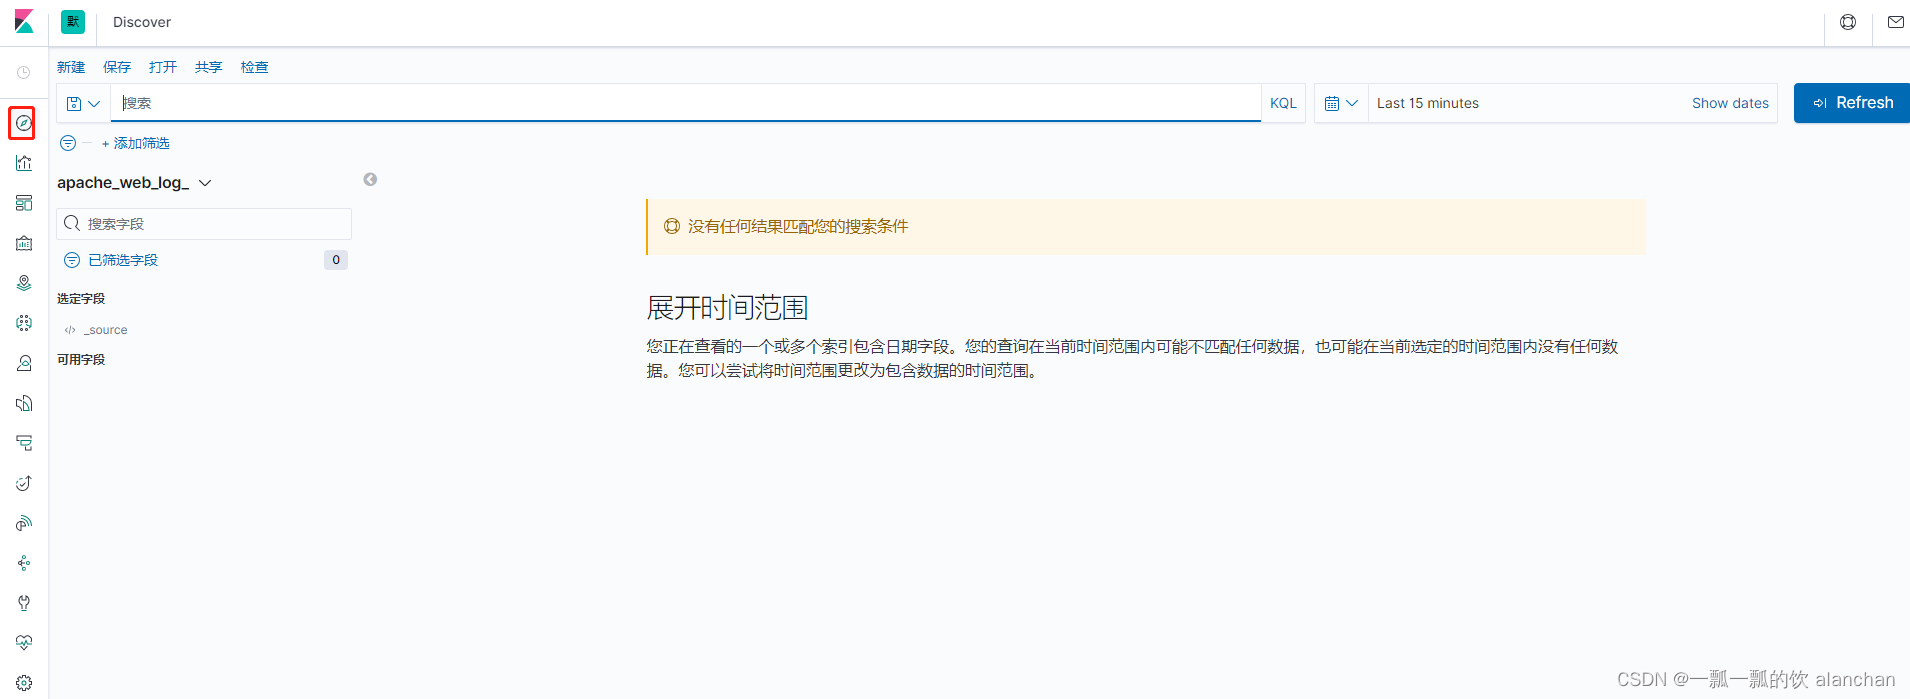
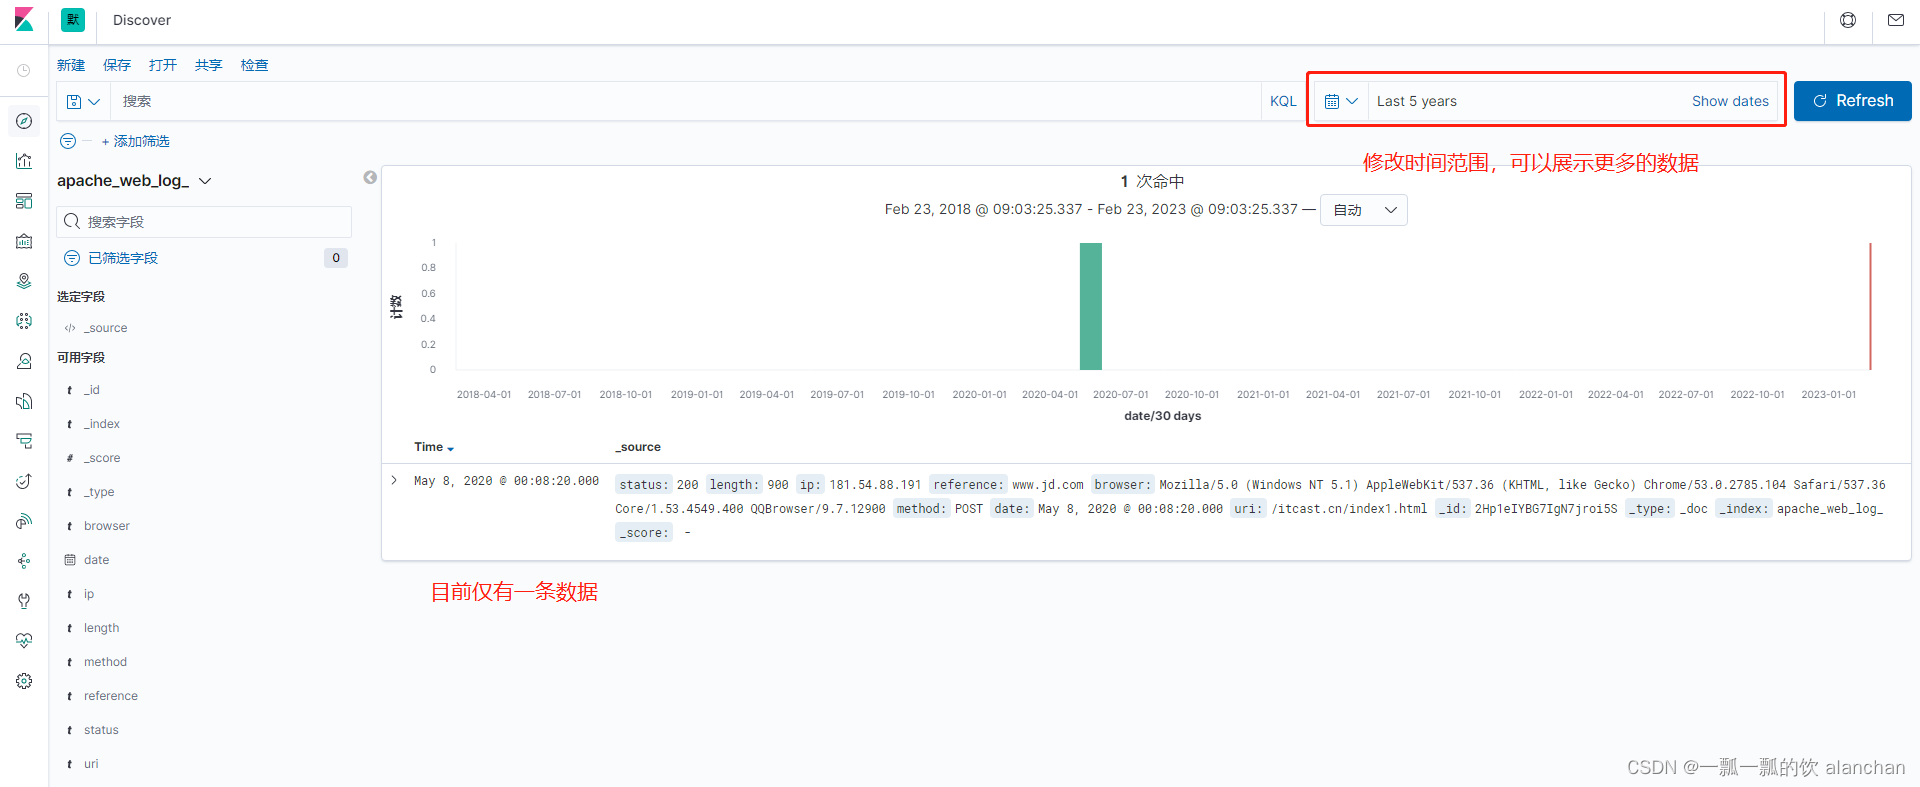
通过Kibana中的Discovery组件,我们可以快速地进行数据的检索、查询。
1.将该文件放入/usr/local/bigdata/testdata/log目录
2. 如果filebeat和logstash没有启动,则执行下面的命令即可
./filebeat-e -c filebeat-logstash.yml
logstash-f ../config/filebeat-es.conf --config.reload.automatic
3.查看数据是否导入进ES,在kibana中也可以看到
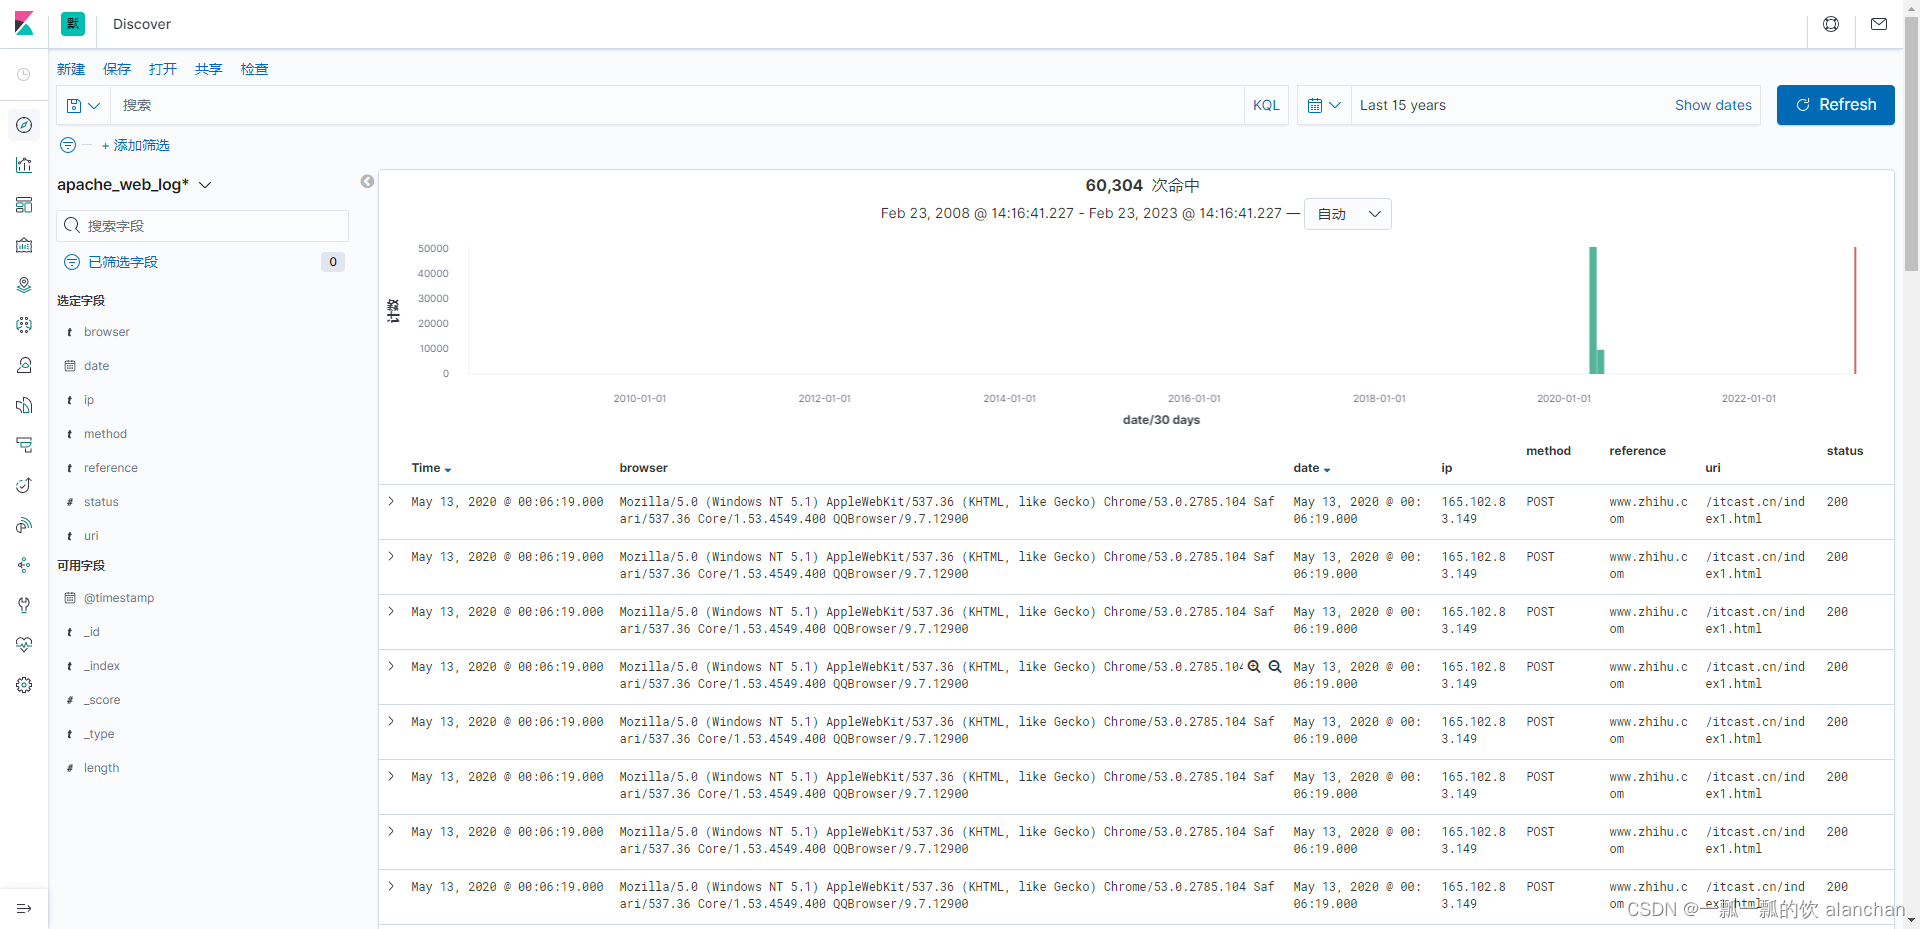
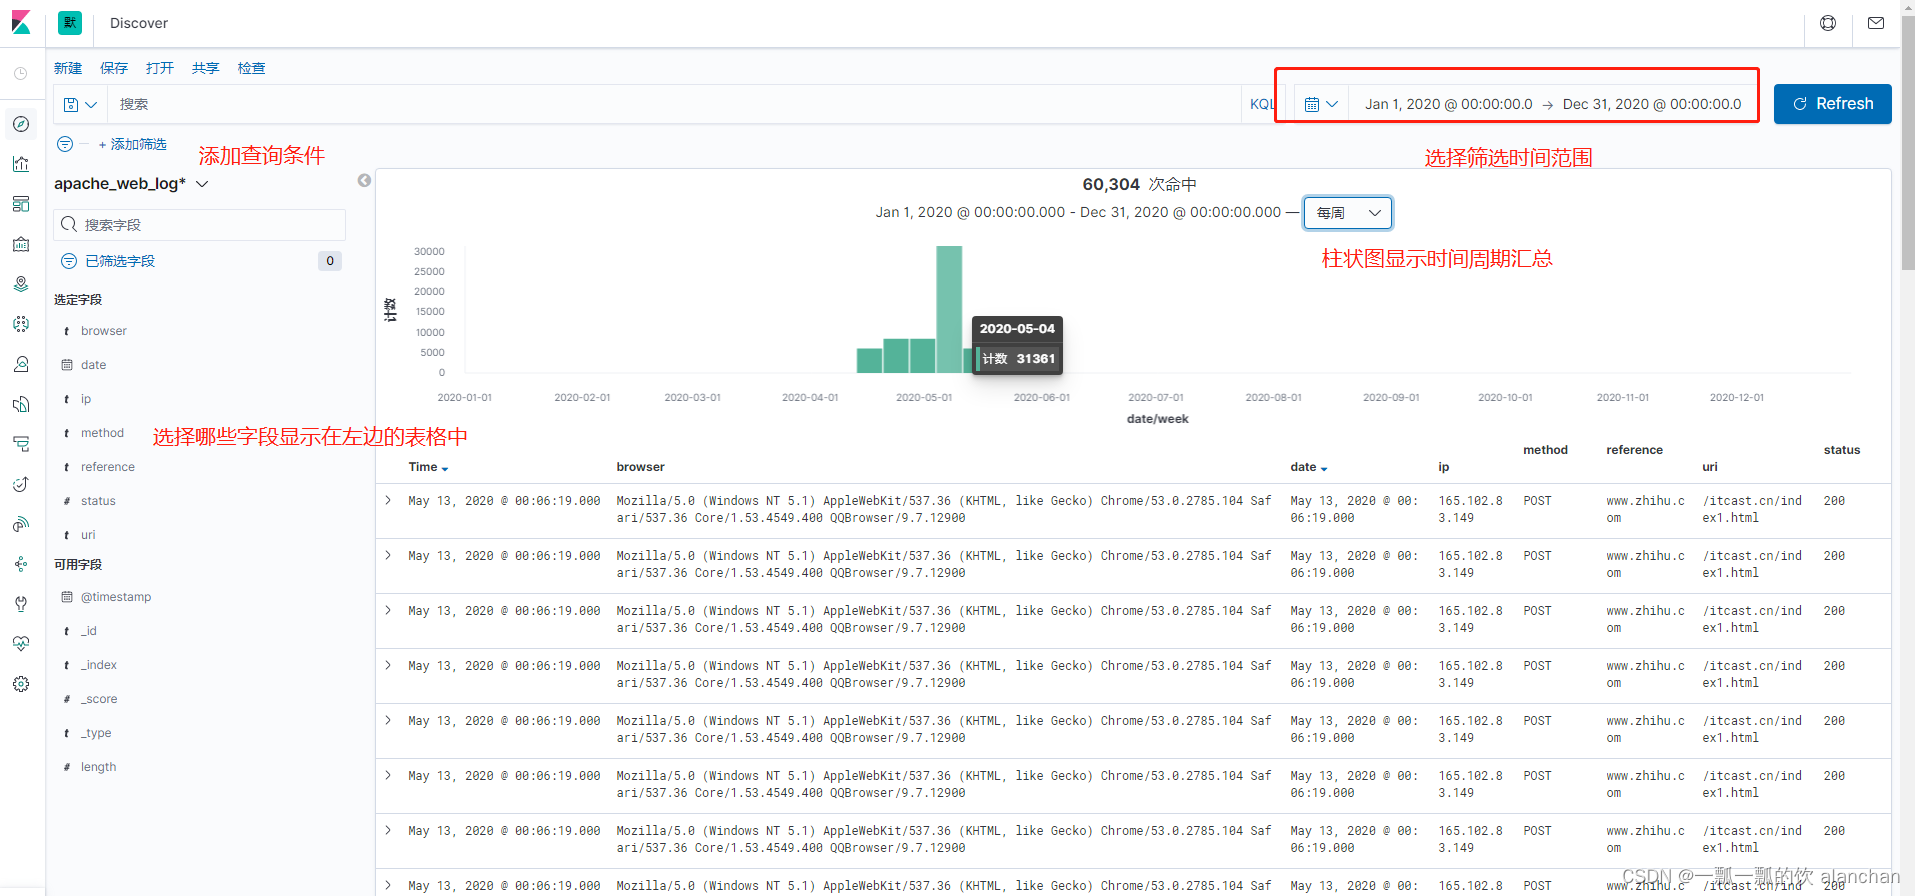
在Kibana的Discovery组件中,可以在查询栏中输入搜索条件。默认情况下,可以使用Kibana内置的标准查询语言,来进行快速查询。还有一种是遗留的基于Lucene的查询语法目前暂时可用,这种查询语法也可以使用基于JSON的Elasticsearch DSL也是可用的。当我们在Discovery搜索数据时,对应的直方图、文档列表都会随即更新。默认情况下,优先展示最新的文档,按照时间倒序排序的。
1、Kibana查询语言(KQL)
在7.0中,Kibana上线了新的查询语言。这种语言简洁、易用,有利于快速查询。
查询语法:「字段:值」,如果值是字符串,可以用双引号括起来。
查询包含zhihu的请求 zhihu
查询页面不存在的请求 status:404
查询请求成功和不存在的请求 status: (404 or 200)
查询方式为POST请求,并请求成功的日志 status: 200 and method: post
查询方式为GET成功的请求,并且响应数据大于512的日志 status: 200 and method: get and length>> 512
查询请求成功的且URL为「/win.cn」开头的日志uri: "/win.cn/*"
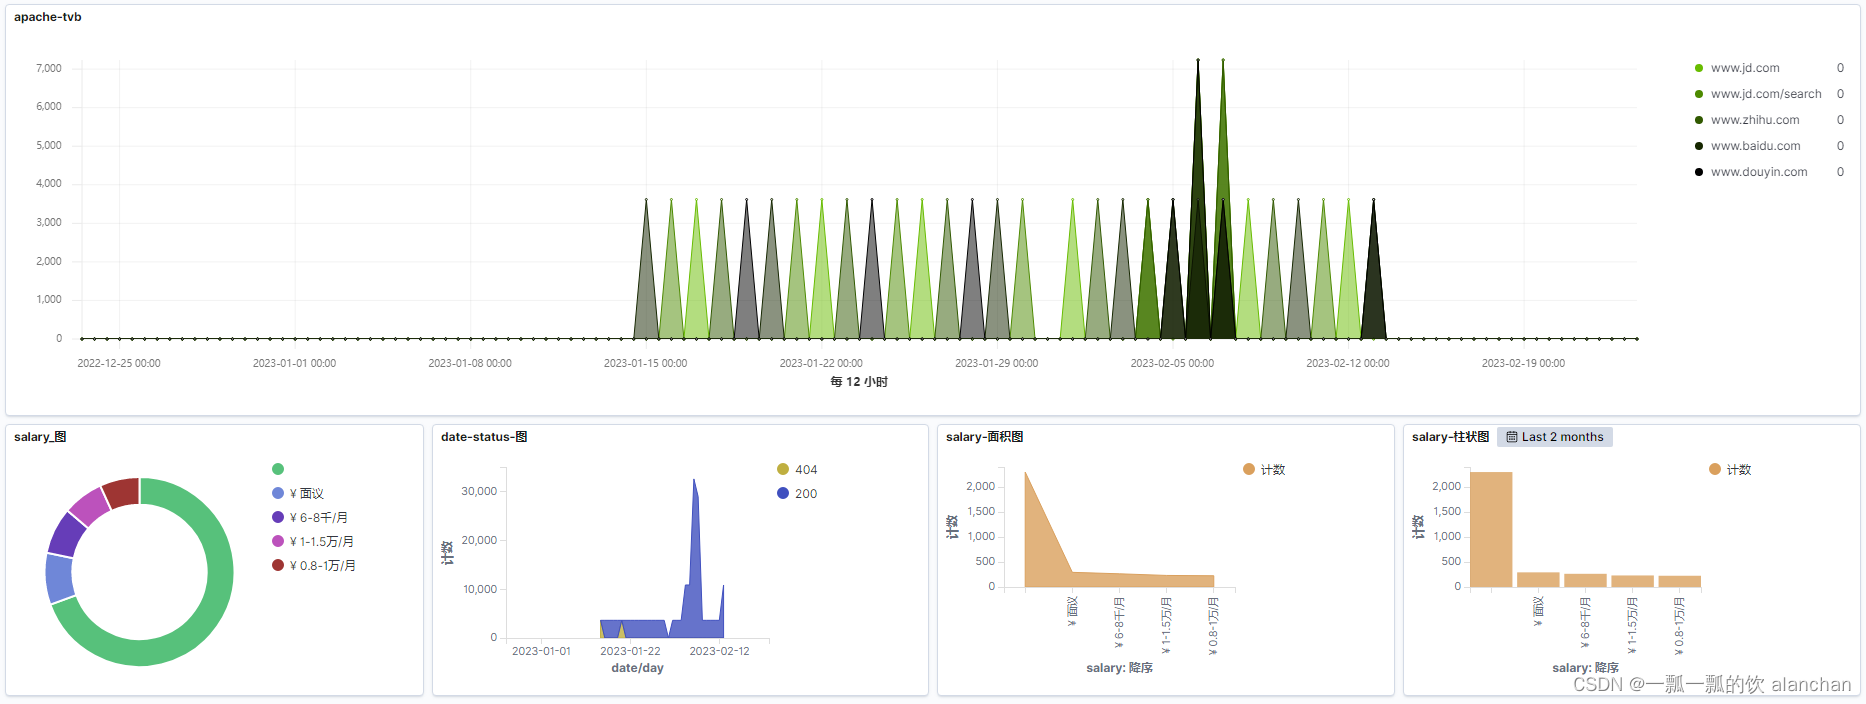
Kibana中的Visualize可以基于Elasticsearch中的索引进行数据可视化,然后将这些可视化图表添加到仪表盘中。
Lens,通过简单地拖拽数据字段,快速构建基本的可视化,常用的可视化对象
仪表盘工具