186
社区成员
 发帖
发帖 与我相关
与我相关 我的任务
我的任务
 分享
分享
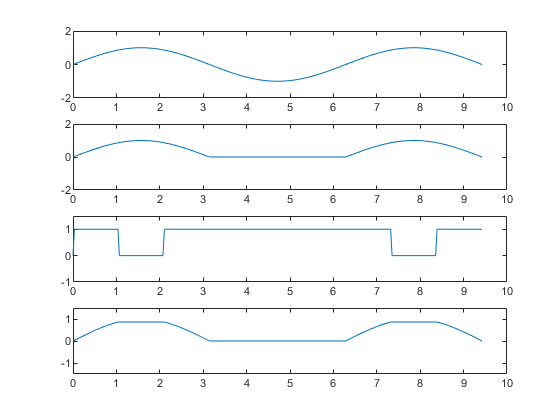
clc,clear,close all;
t = 0:pi/100:3*pi;
y = sin(t);
subplot(411)
plot(t,y)
ylim([-2 2])
subplot(412)
y = sin(t);
y(y<0) = 0;
y1 = y;
plot(t, y1)
ylim([-2 2])  % 刻度范围控制

subplot(414)
y1(y1>sin(pi/3)) = sin(pi/3);
                                % 等效代码
                                % for i = 1:length(y1)
                                %     if y1(i)>sin(pi/3)
                                %         y1(i) = sin(pi/3);
                                %     end
                                % end
plot(t,y1)
axis([0,10,-1.5,1.5])

subplot(413)
                                y = sin(t);  % y重新赋值
                                % 等效代码
                                % for i = 1:length(y)
                                %     if y(i) > sin(pi/3)
                                %         y(i) = 0;
                                %     else
                                %         y(i) = 1;
                                %     end
                                % end
y(y>=sin(pi/3)) = 0;
y(y~=0) = 1;
plot(t,y)
axis([0,10,-1,1.5])