Team Geeks - Beta Sprint Log 1
目录
- 1. Scrum Section
- Burn up map
- Picture of current project
- Achievements:
- Commit screenshot :
- Conference photo:
- 2. PM Report
- Expected Tasks:
- Completed Work:
- Remaining Work:
- Notes:
- Progress Assessment:
- Issues and Risks:
1. Scrum Section
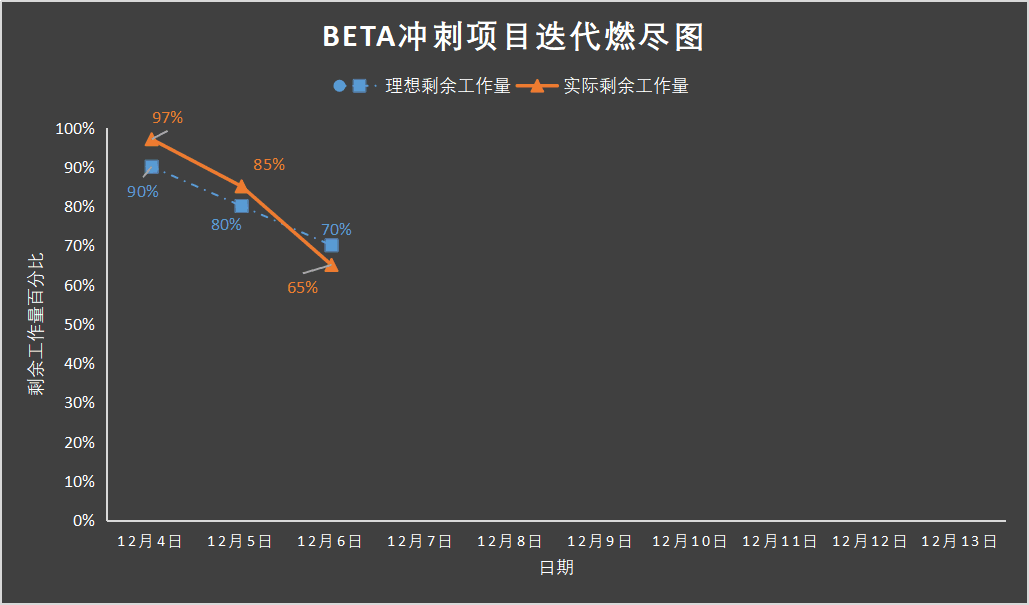
Burn up map
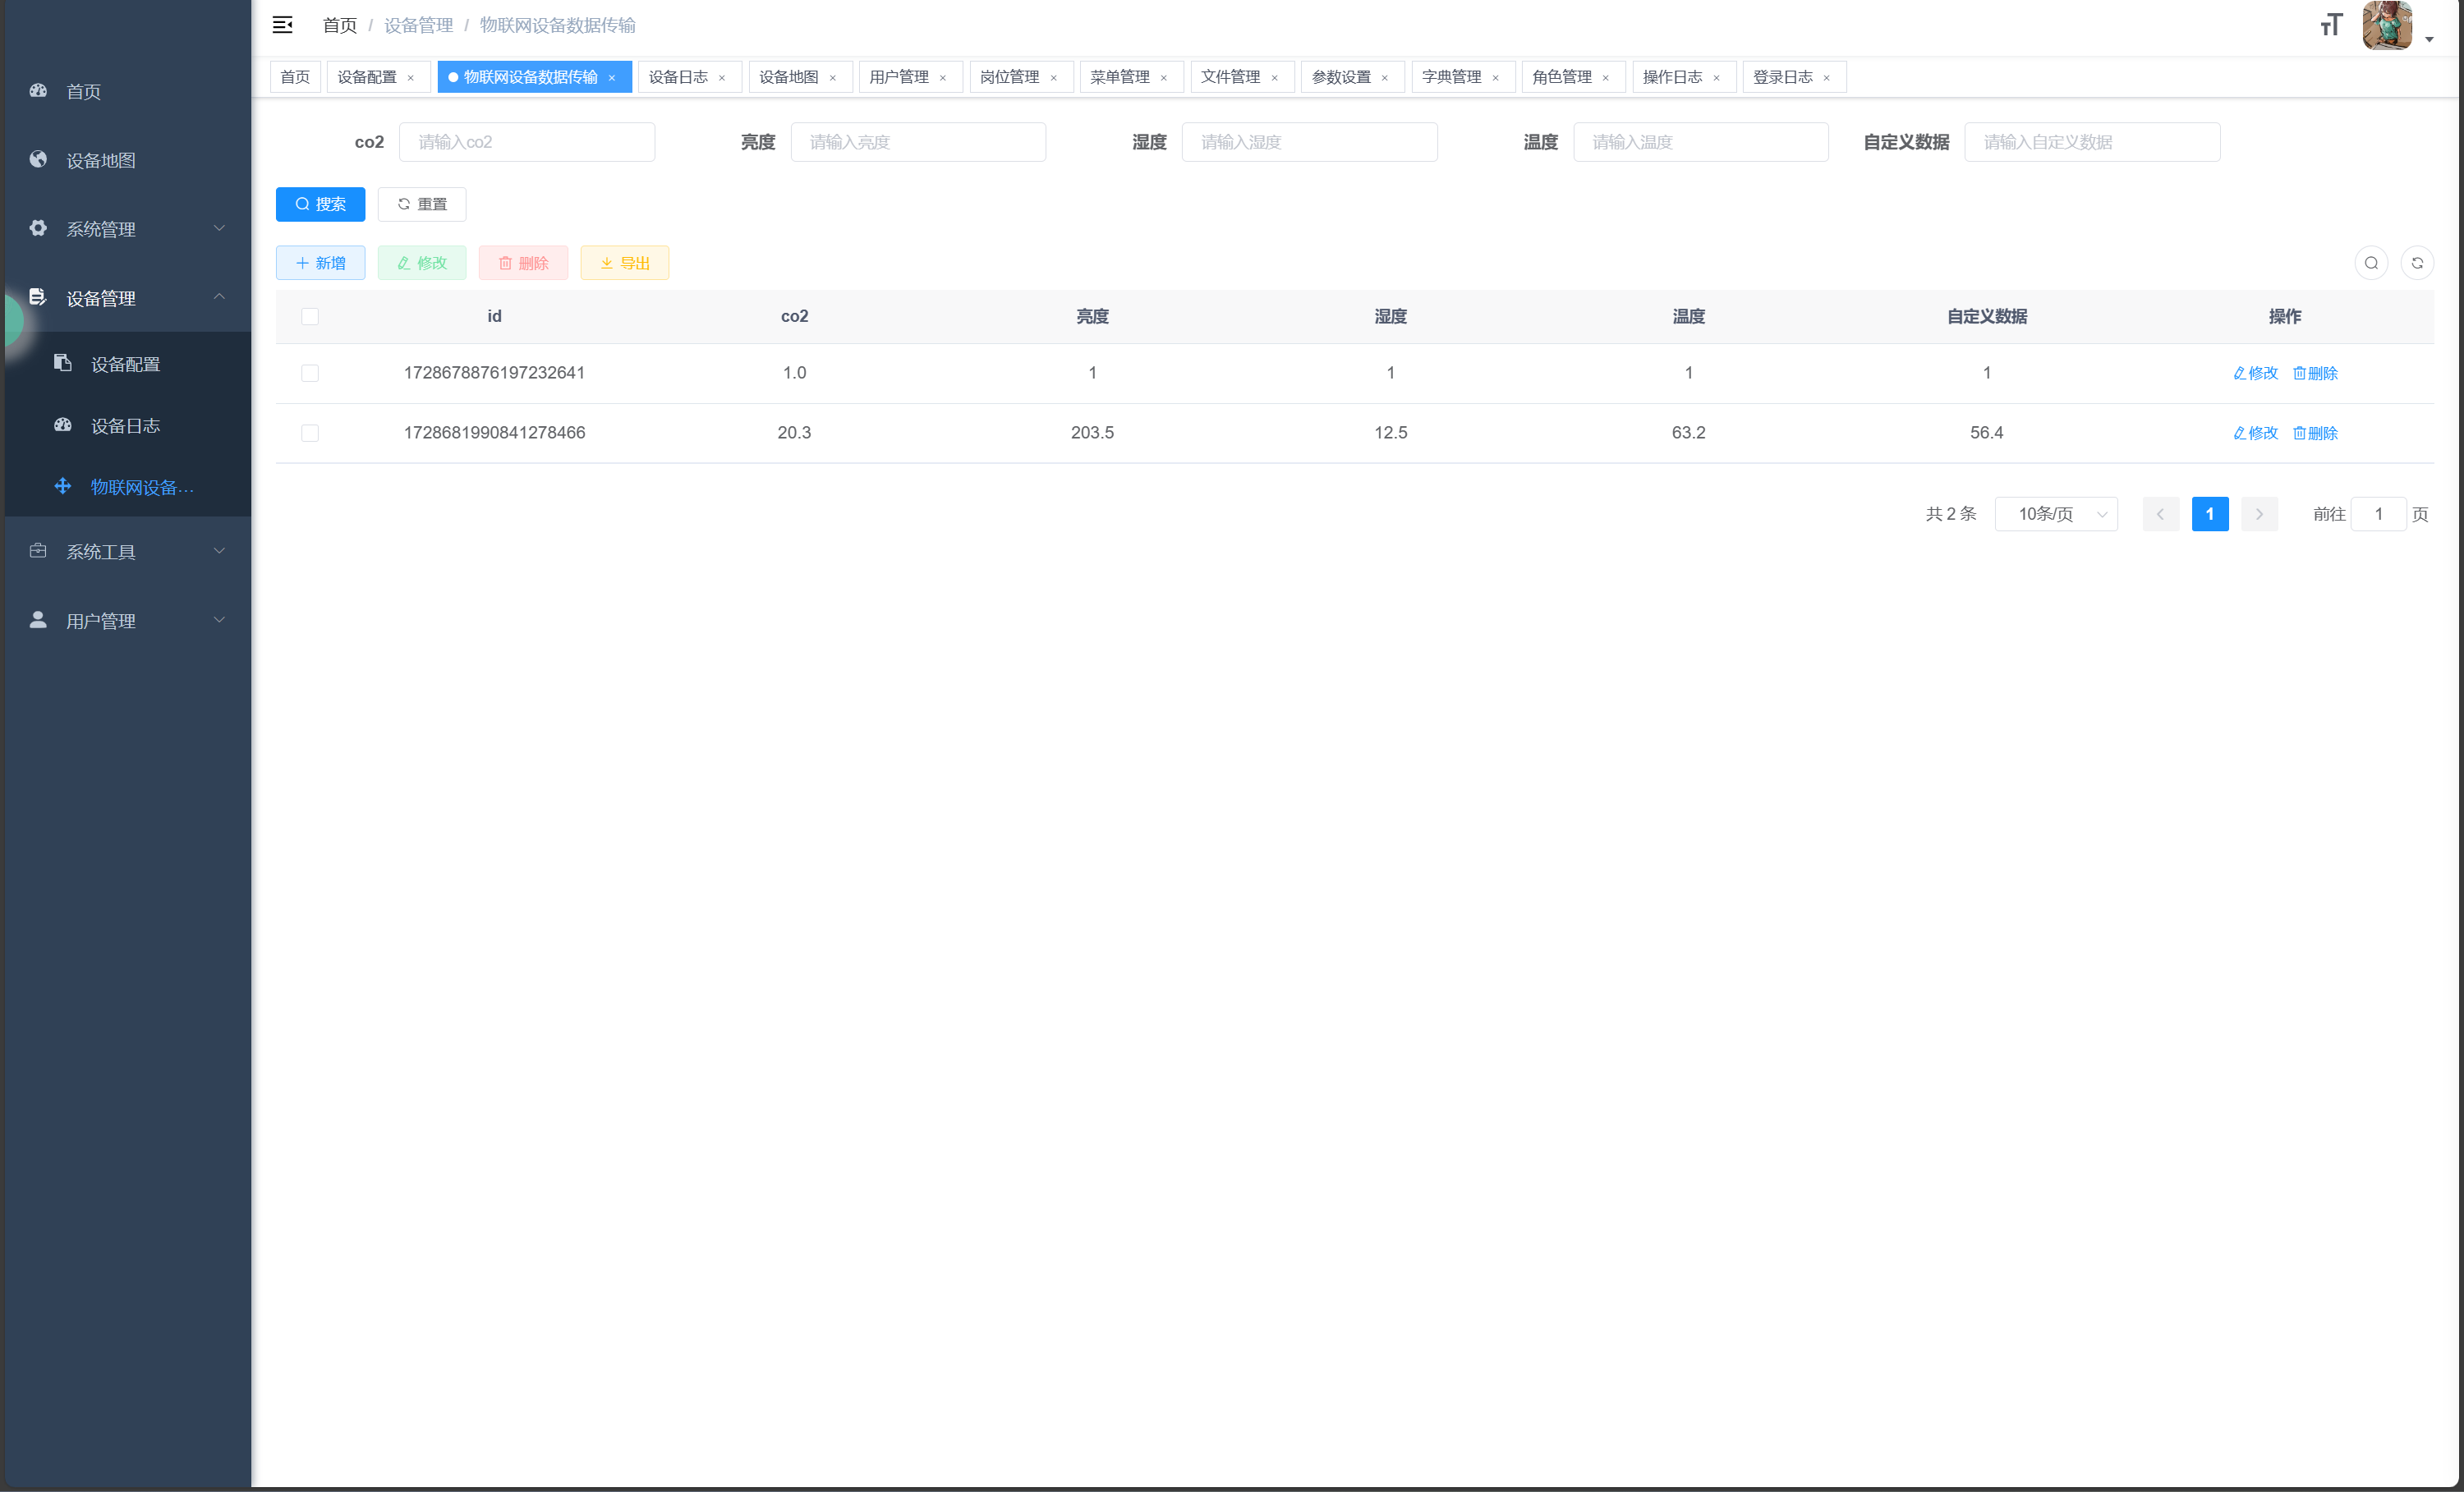
Picture of current project
Achievements:
周玥 :
- Modified the template to include two
div elements, one for the chart and another for the chart's ID, each with dynamic styling. - Adjusted the default height of the chart for better user experience.
- Implemented the
autoResize prop to enable automatic resizing of the chart based on window dimensions. - Utilized the
echarts library to initialize and configure the chart with specified options. - Created a method (
setOptions) to set chart options, including x-axis, y-axis, tooltip, legend, and series configurations. - Incorporated API calls to fetch data (
warnNumPerHour()) and dynamically update the chart with real-time information. - Styled the chart with a color gradient for visual distinction between expected and actual data.
黄家成 :
- Modified the template to include a
div element for the pie chart with dynamic styling. - Integrated the 'macarons' theme from ECharts for a visually pleasing design.
- Utilized the
echarts library to initialize and configure the pie chart with specified options. - Created a method (
initChart) to set chart options, including tooltip, legend, series configurations, and dynamic data updates. - Incorporated API calls to fetch real-time device warning information and update the pie chart accordingly.
姚依林 :
- Top Data Section:
- Displays various data boxes containing icons and information.
- The information includes the current warning count, total log count, visible equipment count, and today's visible device warning count.
- Line Chart:
- Uses the ECharts library to create a line chart.
- Shows the trend of some data over months.
- The data includes values for different months.
- Bottom Data Section:
- Includes an
el-card component for the "日志面板" (log panel) with tabs for different log categories. - Each tab contains a table with specific columns and data related to user management, device logs, configuration management, and role management.
- Pie Chart:
- Uses the ECharts library to create a pie chart.
- Represents data related to access sources, such as search, direct access, email, union, and video.
- Responsive Design:
- The CSS includes responsive design adjustments for different screen sizes.
- Event Handling:
- Uses event listeners to handle the dynamic resizing of the line and pie charts when the window size changes.
- API Calls:
- Utilizes API calls to fetch data related to device configuration, warnings, warnings today, device logs, and device data transmission.
- Vue Lifecycle Hooks:
- Uses the
created, mounted, and destroyed lifecycle hooks to initialize, mount, and clean up chart instances.
蔡心林 :
- Query Form Section:
- Utilizes the Element UI (
el-form, el-form-item, el-input) for creating a form with inline layout. - Provides input fields for filtering device configurations based on criteria such as device name, location latitude, location longitude, CO2 range, alarm threshold, luminance range, humidity range, and temperature range.
- The form is bound to the
queryParams data object.
- Device Configuration Table:
- Uses the Element UI
el-table to display a list of device configurations. - Includes selection functionality (
el-table-column type="selection") for selecting multiple rows. - Displays various columns such as ID, device name, location latitude, location longitude, alarm threshold, CO2 range, luminance range, humidity range, and temperature range.
- Fetches data from an API using the
listDeviceConfig method.
- Dialog for Adding/Updating Device Configurations:
- Uses
el-dialog to create a modal dialog for adding or updating device configurations. - Contains an
el-form with input fields for device name, location latitude, location longitude, alarm threshold, CO2 range, luminance range, humidity range, and temperature range. - The form is bound to the
form data object. - Includes validation rules for required fields.
- Data Binding and Methods:
- Uses the
v-model directive for two-way data binding between form fields and data properties. - Defines the
handleQuery method to perform the query based on the entered criteria. - Uses the
getList method to fetch device configurations from the API and update the table.
- Responsive Design:
- Adjusts the layout and styling for responsiveness.
林泳坤 :
- User Data Table:
- Uses the Element UI
el-table to display a list of user data. - Includes selection functionality (
el-table-column type="selection") for selecting multiple rows. - Displays various columns such as user ID, username, user type, phone, email, and visible range.
- Fetches data from an API using the
listUser method.
- Dialog for Adding/Updating User Data:
- Uses
el-dialog to create a modal dialog for adding or updating user data. - Contains an
el-form with input fields for username, password, user type, phone, email, and a multi-select field for visible range. - The form is bound to the
form data object. - Includes validation rules for required fields.
- Data Binding and Methods:
- Uses the
v-model directive for two-way data binding between form fields and data properties. - Defines methods like
handleQuery for querying user data, handleAddOrUpdate for adding or updating user data, and handleDelete for deleting user data. - Uses the
getList method to fetch user data from the API and update the table. - Implements export functionality using the
handleExport method.
- Initialization:
- Calls the
getList method in the created lifecycle hook to initially fetch user data. - Fetches equipment names (possibly related to device configuration) using the
getDeviceName method and populates the equipmentName array.
- Select Component for Visible Range:
- Uses
el-select for the multi-select field (visible range), populating options dynamically from the equipmentName array.
许嘉森 :
- Template Section:
- Uses the Element UI (
el-form, el-form-item, el-input) for creating a login form. - The form includes an input field for the username and another for the password.
- Applies validation rules for the username field using the
:rules attribute.
- Styling Section:
- Defines styling for the login container, setting a background image with a cover property.
- Specifies styles for the title, login form, and input fields.
- Adds background images and adjusts styling for layout and appearance.
- Background Image:
- Sets a background image for the login container, either from
"../assets/images/login-background.jpg" or "../assets/images/background.png". - Adjusts the background size to cover the container.
- Form Styling:
- Styles the login form with a border radius, background color, width, and padding.
- Adjusts the height and styling of the input fields using the
.el-input class. - Adds styling for the input icon and login tip.
- Footer Section:
- Includes a footer with copyright information.
- Applies styling to the footer, setting its position, height, line-height, text color, font family, size, and letter spacing.
- Login Code Styling:
- Styles the login code section, including its width, height, and positioning.
- Adds styling for the login code image, setting its height.
- Additional Styling:
- Sets styles for the login tip, adjusting font size, text alignment, and color.
- Dynamic Styling:
- Uses dynamic styling for some properties, such as the background image URL and the height of the input fields.
范文卓:
- HTML Template:
- Contains an input field for searching locations using AMap's autocomplete feature.
- Displays information about the selected location, including longitude, latitude, and detailed address.
- Includes a map container with the ID "container" for rendering the AMap.
- Data Section:
- Initializes data properties such as
map, marker, geoCoder, AutoComplete, keywords, form, loading, and options in the component's data function. keywords is used for storing the search query.form is used for storing the information about the selected location.loading is a flag for indicating when the search is in progress.options is an array that holds search suggestions.
- Methods Section:
initMap: Initializes the AMap by loading the AMap JS API and setting up map-related plugins like Geocoder and AutoComplete.map: Is invoked within initMap and initializes the AMap instance with specific options.setMapMarker: Sets a marker on the map based on the selected location.removeMarker: Removes the existing marker from the map.toGeoCoder: Invokes the GeoCoder to obtain the address based on the provided latitude and longitude.remoteMethod: Handles remote searching as the user types, providing search suggestions.currentSelect: Handles the selection of a location from the search suggestions.
- Lifecycle Hook (Mounted):
- Calls the
initMap method when the component is mounted, initializing the AMap and setting up the map.
- Style Section:
- Defines styles for the container, adjusting its width and height.
- Includes responsive styles using
@media queries to adjust the font size and input width based on the screen width.
- Additional Notes:
- Uses AMap's Geocoder for reverse geocoding (converting coordinates to an address).
- Utilizes AMap's AutoComplete for providing location suggestions as the user types.
- Displays markers on the map for different locations, with different icons based on whether the location has an error (
icon1 or icon2). - The map is initialized with a default center and zoom level.
孙仲恒:
- HTML Template:
- Uses the Element UI (
el-form, el-input, el-button, etc.) for form and input field components. - Includes input fields for the username, password, and confirmation password.
- Optionally includes a captcha input field and an image for captcha verification (
el-form-item with v-if="captchaEnabled"). - Displays a button for user registration.
- Provides a link to redirect users to the login page.
- Data Section:
- Initializes data properties such as
codeUrl, registerForm, registerRules, loading, and captchaEnabled in the component's data function. registerForm is an object containing form data for registration, including username, password, confirmation password, code, and userType.registerRules defines validation rules for form fields.loading is a flag indicating whether the registration process is in progress.captchaEnabled is a flag indicating whether captcha verification is enabled.
- Methods Section:
equalToPassword: A custom validator function to check if the confirmation password matches the password.getCode: Fetches a captcha image and updates the component's data.handleRegister: Handles the registration process. It validates the form, triggers registration API call, and displays a success alert if successful.
- Lifecycle Hook (Created):
- Invokes the
getCode method when the component is created to fetch the initial captcha image.
- Styles Section:
- Includes styling for the registration form, input fields, icons, and footer.
- Additional Notes:
- The component uses Element UI for styling and form validation.
- It makes use of a custom SVG icon component (
svg-icon) for icons in the input fields. - The background image for the registration form is set using
background-image. - The registration form supports captcha verification if
captchaEnabled is true. - The registration form provides visual feedback to users during the registration process using the
loading flag. - Upon successful registration, a success alert is displayed, and users are redirected to the login page.
孙逊:
HTML Template:
- Uses Element UI components for layout and form elements.
- Divided into two sections: one for department data and another for user data.
- Displays a tree structure for departments (
el-tree). - Uses a form to filter and search users (
el-form, el-input, etc.). - Shows user data in a table (
el-table).
Data Section:
- Contains properties such as
deptName, initPassword, and dateRange. - Manages user-related data, including a list of users (
userList), user roles, and posts. - Utilizes flags like
open to control the visibility of modal dialogs. - Uses
queryParams to store parameters for querying users. - Contains options for user roles and posts (
roleOptions and postOptions).
Lifecycle Hook (Created):
- Invokes methods like
getList, getDeptTree, and getConfigKey when the component is created.
Methods Section:
- Implements methods to handle user actions such as adding, updating, deleting, and resetting passwords.
- Provides functionality for querying, filtering, and managing user roles.
- Supports importing and exporting user data.
- Includes methods for handling file uploads.
Watchers Section:
- Watches changes to the
deptName property and filters the department tree accordingly.
Styling:
- No specific styling information is included in the provided code snippet.
Additional Notes:
- Uses the Element UI library for UI components.
- Incorporates features like tree structures, tables, forms, and modals for user interaction.
- Handles various user-related operations, including CRUD actions and role management.
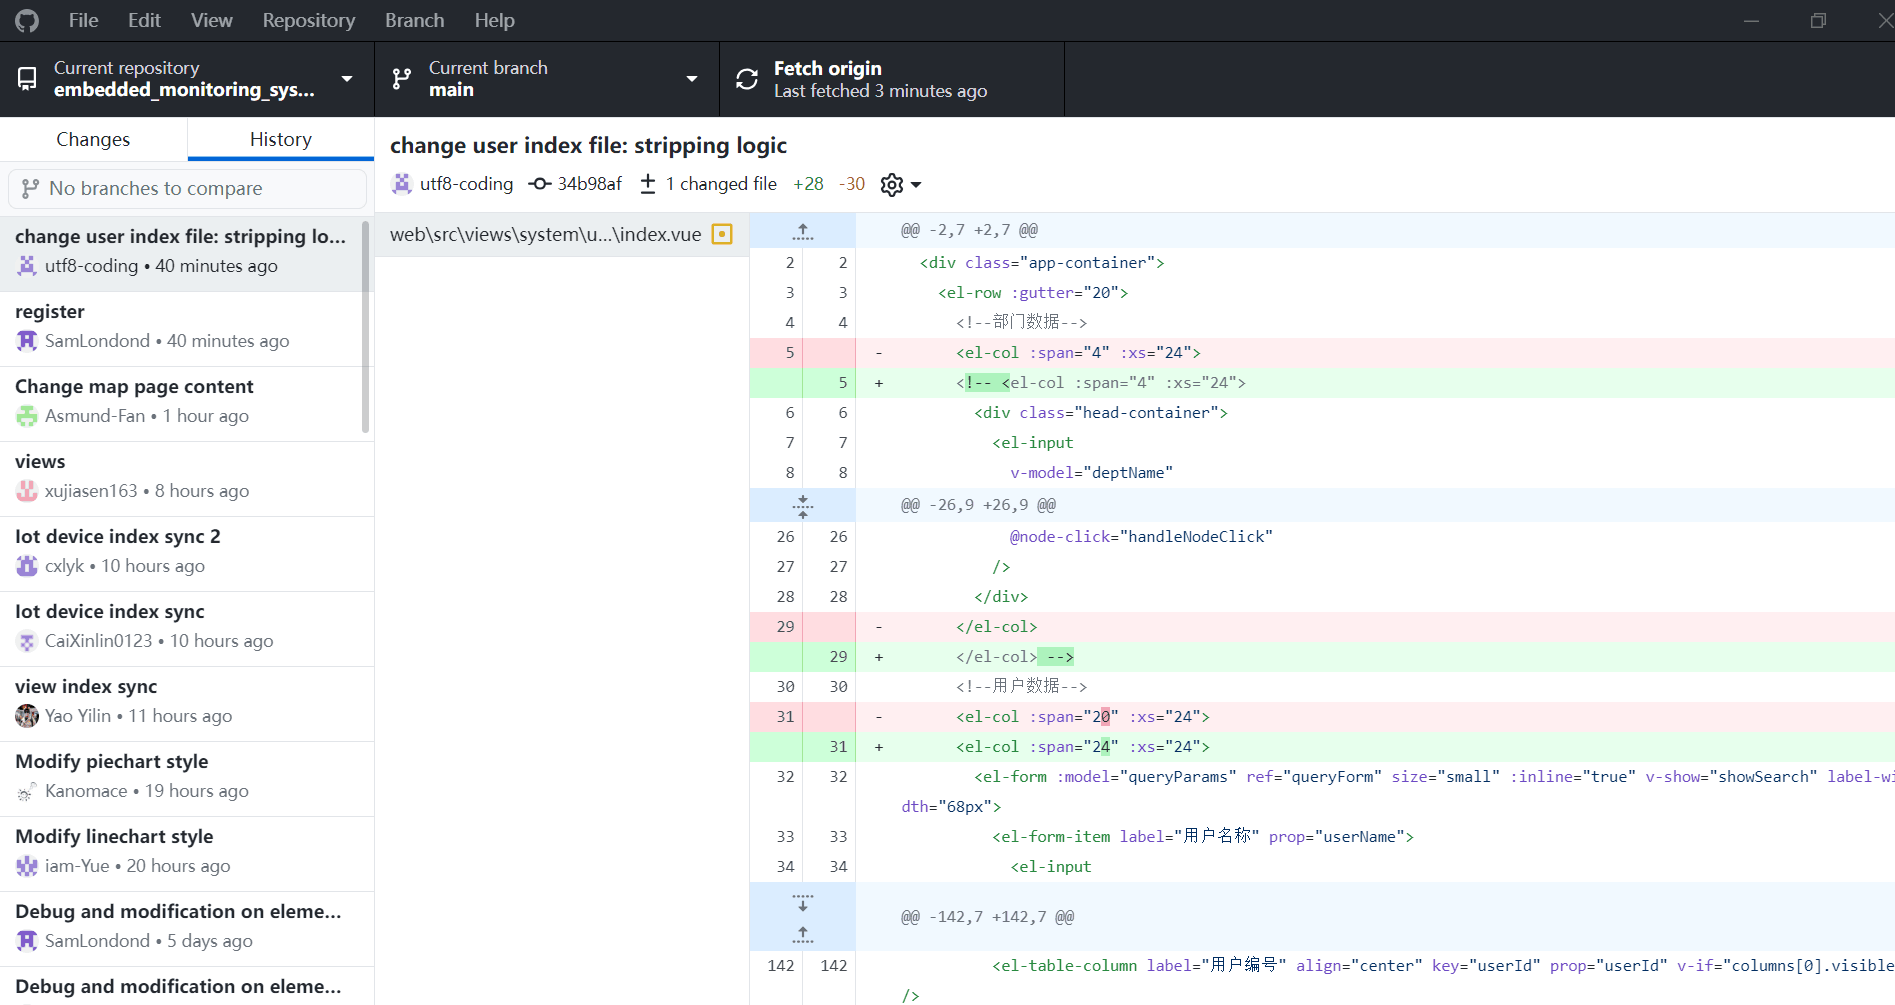
Commit screenshot :
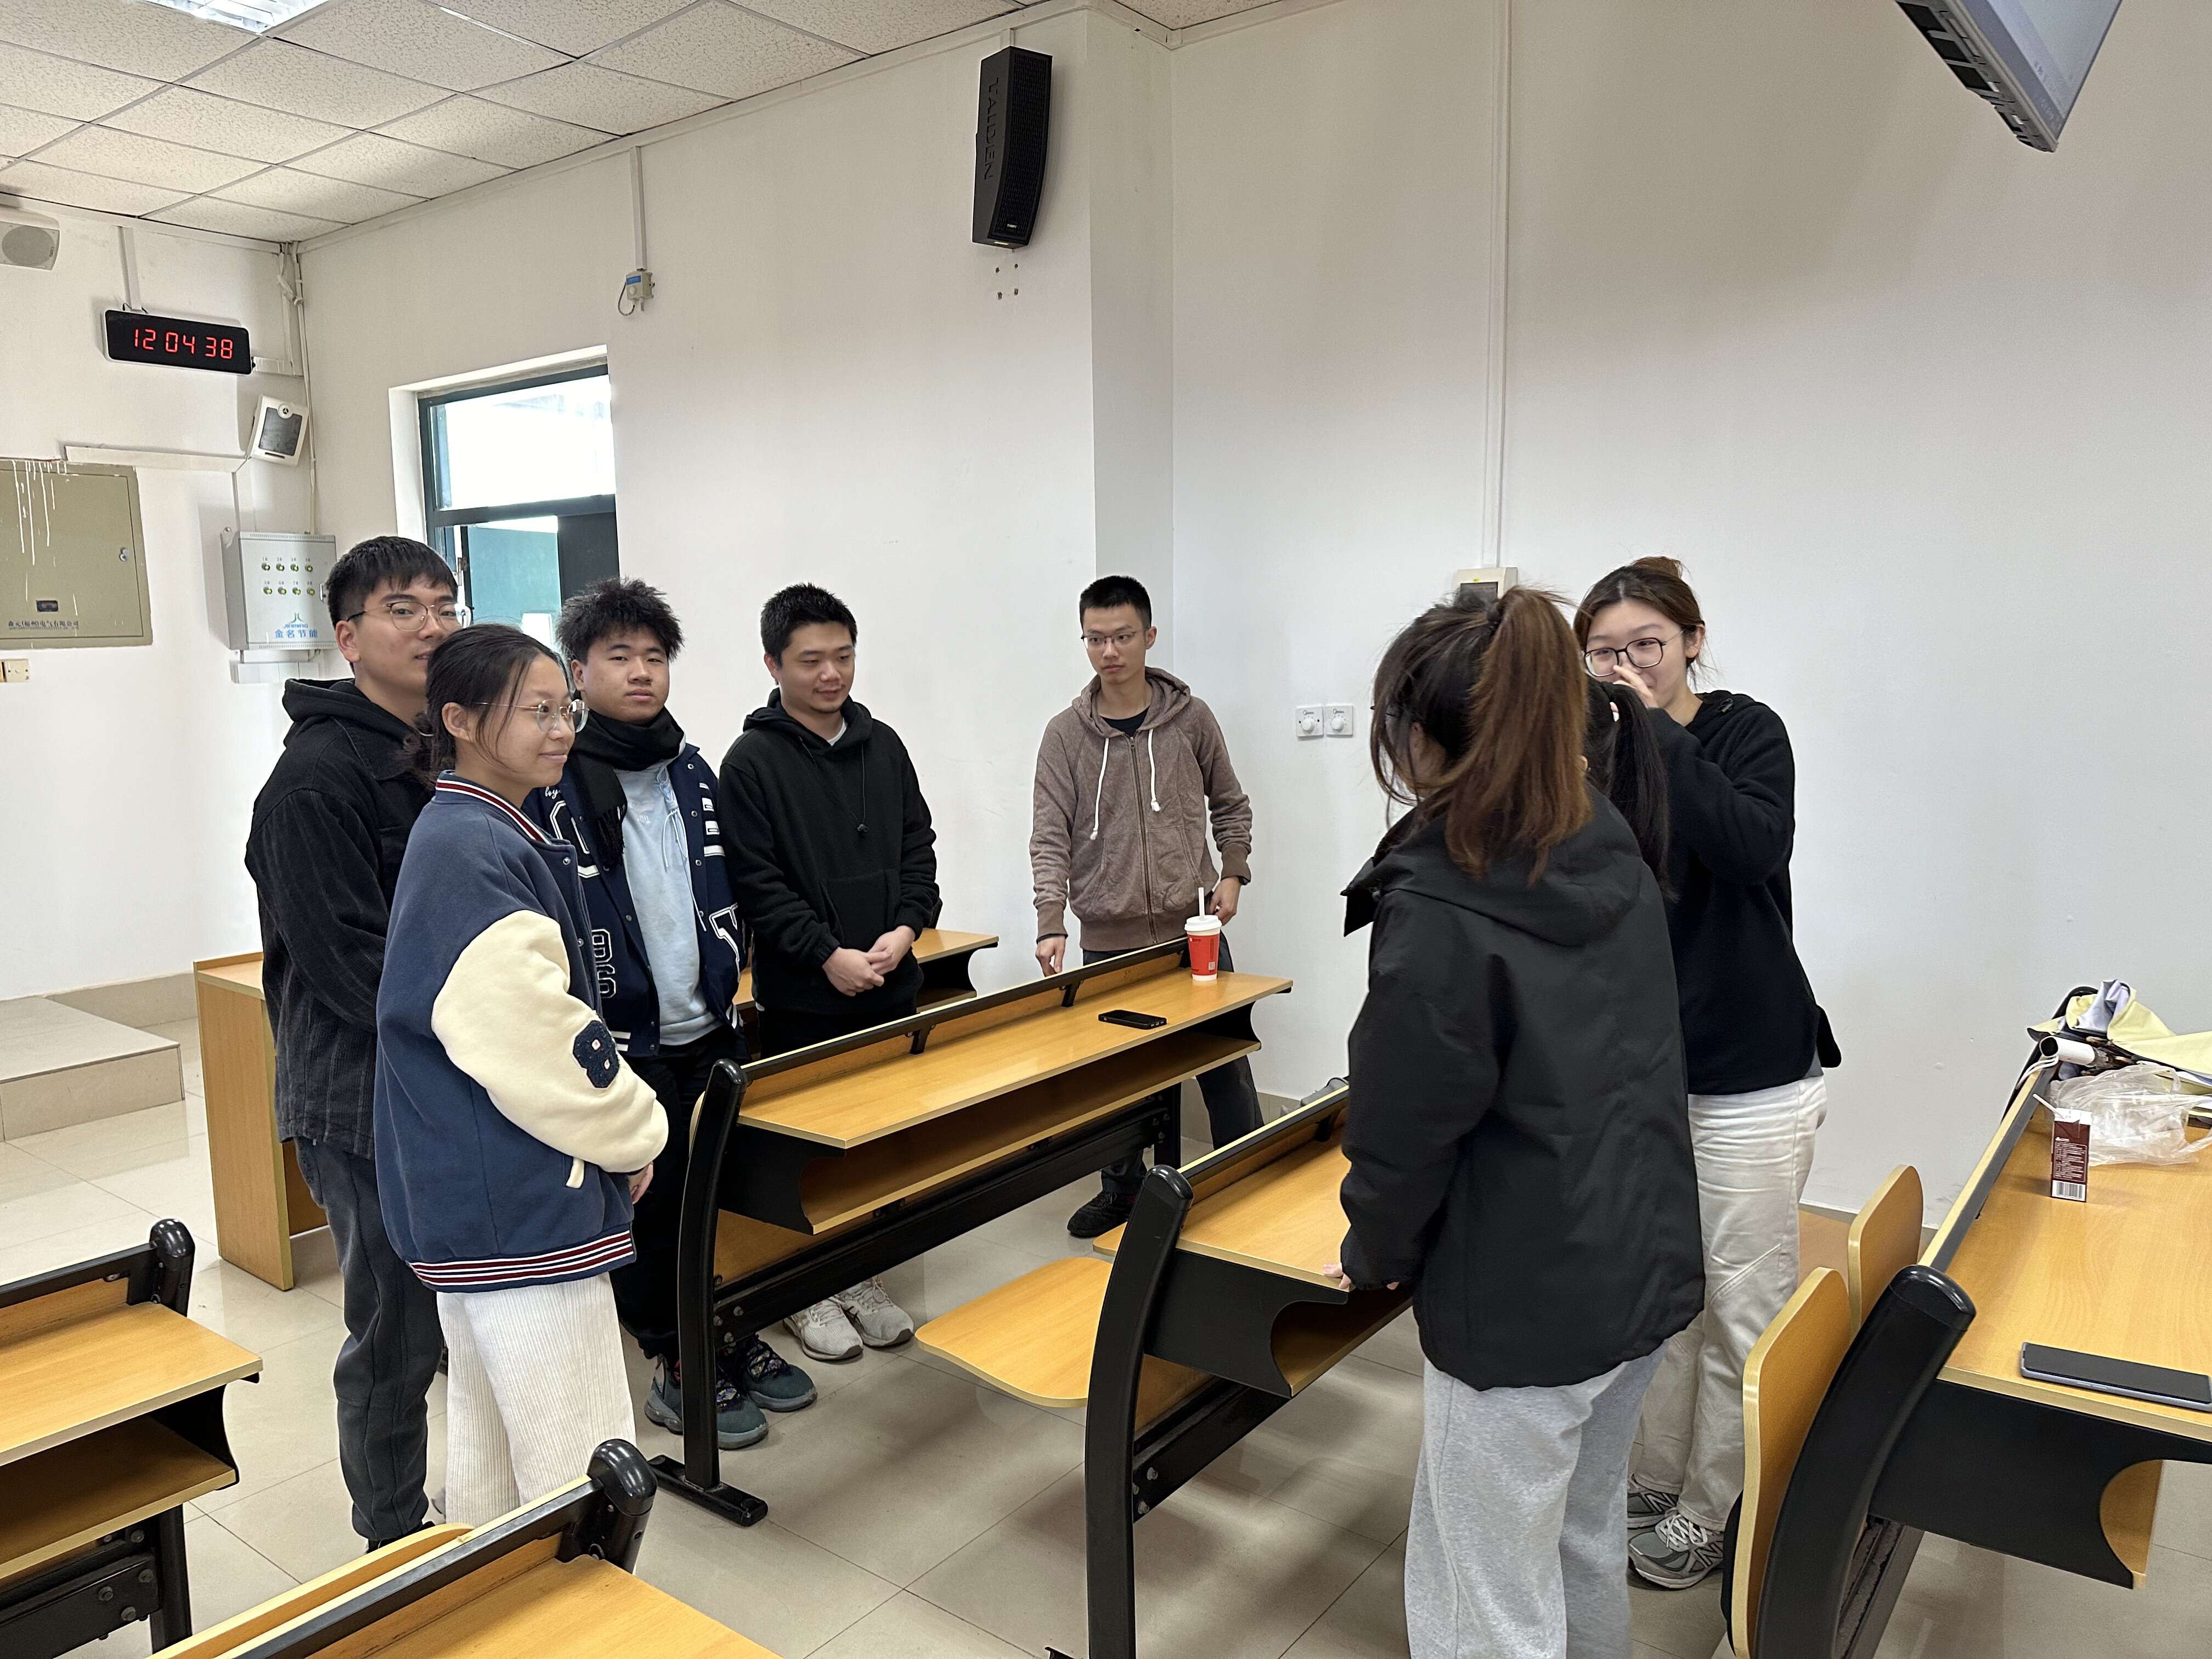
Conference photo:
2. PM Report
Expected Tasks:
- Finish project document.
- Design UI/UX components and layouts.
- Improve frontend functionality using Vue.js.
- Integrate with improved backend APIs for data management.
- Test the application for functionality and performance.
- Handle security considerations and implement user authentication.
- Deploy the application to a production environment.
Completed Work:
- Define Project Requirements: 1 week
- UI/UX Design: 1 week
- Vue.js Frontend Implementation: 3 weeks
- Backend API Integration: 1 week
- Testing and Debugging: 1 week
- Security Implementation: 1 week
- Deployment: 1 week
- Start Date: 2023.10.01
- Current Date: 2023.12.06
- Expected Total Duration: 10 weeks (2023.10 to 2023.12.10
- Define Project Requirements: Completed
- UI/UX Design: Completed
- Vue.js Frontend Implementation: Completed
- Backend API Integration: Completed
- Testing and Debugging: Not started
- Security Implementation: Not started
- Deployment: Not started
Remaining Work:
- User Authentication: 1 week
- Deployment Optimization: 1 week
Notes:
Progress Assessment:
- The frontend implementation and backend integration are currently on track.
- Future progress will depend on the completion of testing, security implementation, and deployment steps.
Issues and Risks:
- Identify any issues or risks that might impact the project timeline.
- Unexpected complexities in the security implementation or delays in backend API development.


 发帖
发帖 与我相关
与我相关 我的任务
我的任务
 分享
分享


