

4,270
社区成员
 发帖
发帖 与我相关
与我相关 我的任务
我的任务 分享
分享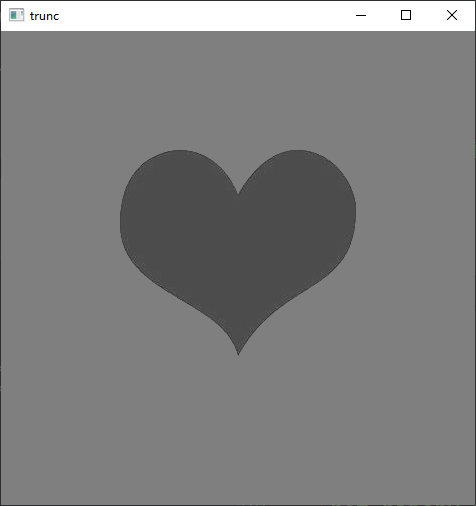
import cv2
import matplotlib.pyplot as plt
def show_img(name, img):
cv2.imshow(name, img)
cv2.waitKey(0)
cv2.destroyAllWindows()
heart = cv2.imread('heart.jpg')
heart_gary = cv2.cvtColor(heart, cv2.COLOR_BGR2GRAY)
ret_binary, binary = cv2.threshold(heart_gary, 127, 255, cv2.THRESH_BINARY)
ret_binary_inv, binary_inv = cv2.threshold(heart_gary, 127, 255, cv2.THRESH_BINARY_INV)
ret_trunc, trunc = cv2.threshold(heart_gary, 127, 255, cv2.THRESH_TRUNC)
ret_to_zero, to_zero = cv2.threshold(heart_gary, 127, 255, cv2.THRESH_TOZERO)
ret_to_zero_inv, to_zero_inv = cv2.threshold(heart_gary, 127, 255, cv2.THRESH_TOZERO_INV)
show_img('trunc', trunc)
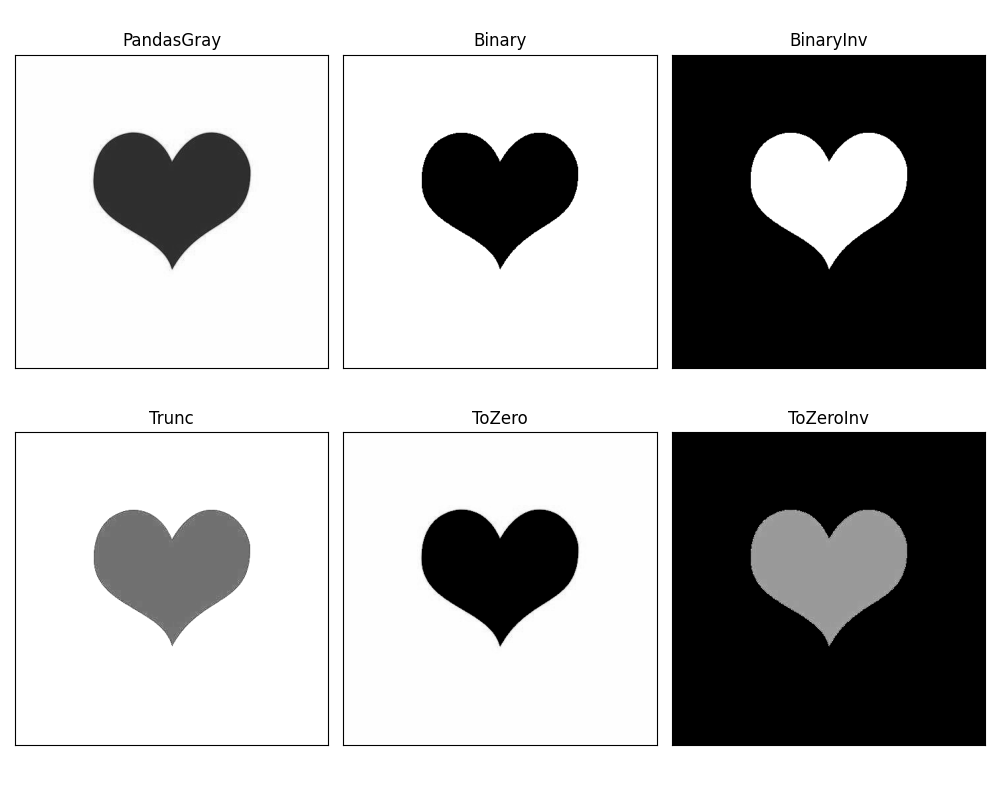
title = ['PandasGray', 'Binary', 'BinaryInv', 'Trunc', 'ToZero', 'ToZeroInv']
images = [heart_gary , binary, binary_inv, trunc, to_zero, to_zero_inv]
# 使用matplotlib显示图像,并设置色彩映射为'gray'
plt.figure(figsize=(10, 8)) # 可以调整图像大小
for i in range(6):
plt.subplot(2, 3, i + 1)
plt.imshow(images[i], 'gray')
plt.title(title[i])
plt.xticks([]), plt.yticks([])
plt.tight_layout() # 调整子图间距
plt.show()
4,270
社区成员
发帖 与我相关 我的任务
 分享
分享


加载中
OpenCV中国团队官方博客:https://blog.csdn.net/opencvchina
试试用AI创作助手写篇文章吧