17,086
社区成员
 发帖
发帖 与我相关
与我相关 我的任务
我的任务
 分享
分享


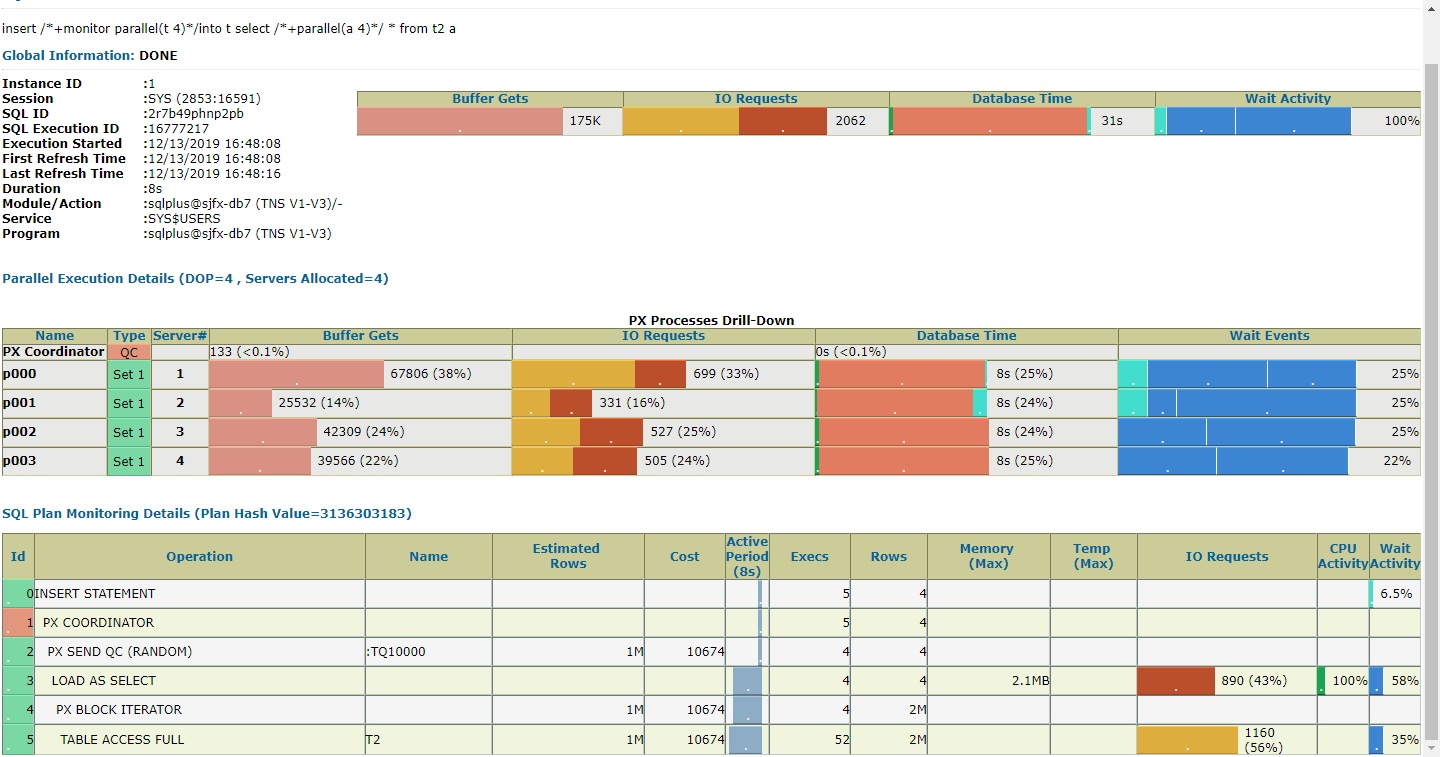
SQL Monitoring Report

SQL Text
------------------------------
insert /*+monitor parallel(t 4)*/into t select /*+parallel(a 4)*/ * from t2 a

Global Information
------------------------------
 Status              :  DONE
 Instance ID         :  1
 Session             :  SYS (2853:16591)
 SQL ID              :  2r7b49phnp2pb
 SQL Execution ID    :  16777217
 Execution Started   :  12/13/2019 16:48:08
 First Refresh Time  :  12/13/2019 16:48:08
 Last Refresh Time   :  12/13/2019 16:48:16
 Duration            :  8s
 Module/Action       :  sqlplus@sjfx-db7 (TNS V1-V3)/-
 Service             :  SYS$USERS
 Program             :  sqlplus@sjfx-db7 (TNS V1-V3)

Global Stats
=================================================================================================
| Elapsed |   Cpu   |    IO    | Concurrency |  Other   | Buffer | Read | Read  | Write | Write |
| Time(s) | Time(s) | Waits(s) |  Waits(s)   | Waits(s) |  Gets  | Reqs | Bytes | Reqs  | Bytes |
=================================================================================================
|      31 |    0.76 |       29 |        0.00 |     0.80 |   175K | 1164 |   1GB |   898 | 222MB |
=================================================================================================

Parallel Execution Details (DOP=4 , Servers Allocated=4)
============================================================================================================================================================
|      Name      | Type  | Server# | Elapsed |   Cpu   |    IO    | Concurrency |  Other   | Buffer | Read | Read  | Write | Write |      Wait Events      |
|                |       |         | Time(s) | Time(s) | Waits(s) |  Waits(s)   | Waits(s) |  Gets  | Reqs | Bytes | Reqs  | Bytes |      (sample #)       |
============================================================================================================================================================
| PX Coordinator | QC    |         |    0.02 |    0.00 |          |             |     0.02 |    133 |      |     . |       |     . |                       |
| p000           | Set 1 |       1 |    7.75 |    0.21 |     7.42 |        0.00 |     0.12 |  67806 |  490 | 469MB |   209 |  52MB | reliable message (1)  |
|                |       |         |         |         |          |             |          |        |      |       |       |       | direct path read (4)  |
|                |       |         |         |         |          |             |          |        |      |       |       |       | direct path write (3) |
| p001           | Set 1 |       2 |    7.72 |    0.14 |     6.92 |             |     0.66 |  25532 |  158 | 149MB |   173 |  43MB | reliable message (1)  |
|                |       |         |         |         |          |             |          |        |      |       |       |       | direct path read (1)  |
|                |       |         |         |         |          |             |          |        |      |       |       |       | direct path write (6) |
| p002           | Set 1 |       3 |    7.70 |    0.20 |     7.50 |             |     0.00 |  42309 |  269 | 256MB |   258 |  64MB | direct path read (3)  |
|                |       |         |         |         |          |             |          |        |      |       |       |       | direct path write (5) |
| p003           | Set 1 |       4 |    7.74 |    0.20 |     7.54 |             |          |  39566 |  247 | 234MB |   258 |  64MB | direct path read (3)  |
|                |       |         |         |         |          |             |          |        |      |       |       |       | direct path write (4) |
============================================================================================================================================================

SQL Plan Monitoring Details (Plan Hash Value=3136303183)
================================================================================================================================================================================
| Id |        Operation        |   Name   |  Rows   | Cost  |   Time    | Start  | Execs |   Rows   | Read | Read  | Write | Write |  Mem  | Activity |    Activity Detail     |
|    |                         |          | (Estim) |       | Active(s) | Active |       | (Actual) | Reqs | Bytes | Reqs  | Bytes | (Max) |   (%)    |      (# samples)       |
================================================================================================================================================================================
|  0 | INSERT STATEMENT        |          |         |       |         1 |     +8 |     5 |        4 |      |       |       |       |       |     6.25 | reliable message (2)   |
|  1 |   PX COORDINATOR        |          |         |       |         1 |     +8 |     5 |        4 |      |       |       |       |       |          |                        |
|  2 |    PX SEND QC (RANDOM)  | :TQ10000 |      1M | 10674 |         1 |     +8 |     4 |        4 |      |       |       |       |       |          |                        |
|  3 |     LOAD AS SELECT      |          |         |       |         7 |     +2 |     4 |        4 |      |       |   890 | 222MB |    2M |    59.37 | Cpu (1)                |
|    |                         |          |         |       |           |        |       |          |      |       |       |       |       |          | direct path write (18) |
|  4 |      PX BLOCK ITERATOR  |          |      1M | 10674 |         7 |     +2 |     4 |       2M |      |       |       |       |       |          |                        |
|  5 |       TABLE ACCESS FULL | T2       |      1M | 10674 |         8 |     +1 |    52 |       2M | 1160 |   1GB |       |       |       |    34.37 | direct path read (11)  |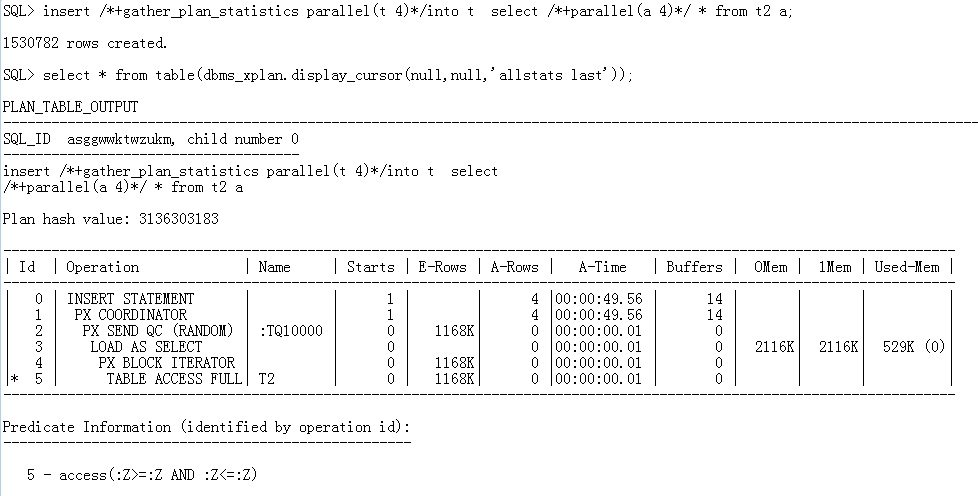
================================================================================================================================================================================ 2、gather_plan_statistics hint + dbms_xplan.display_cursor:
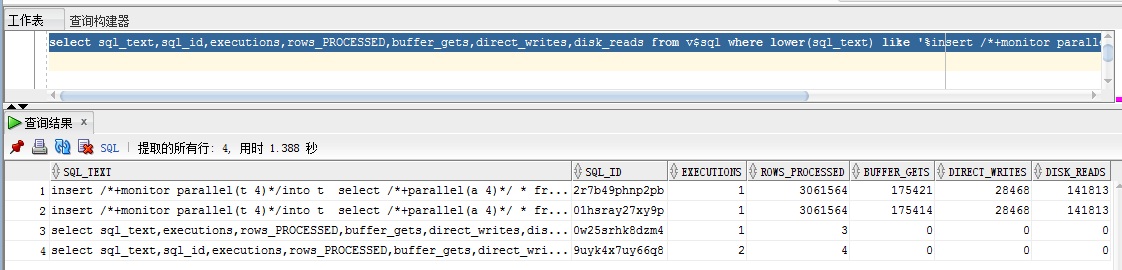
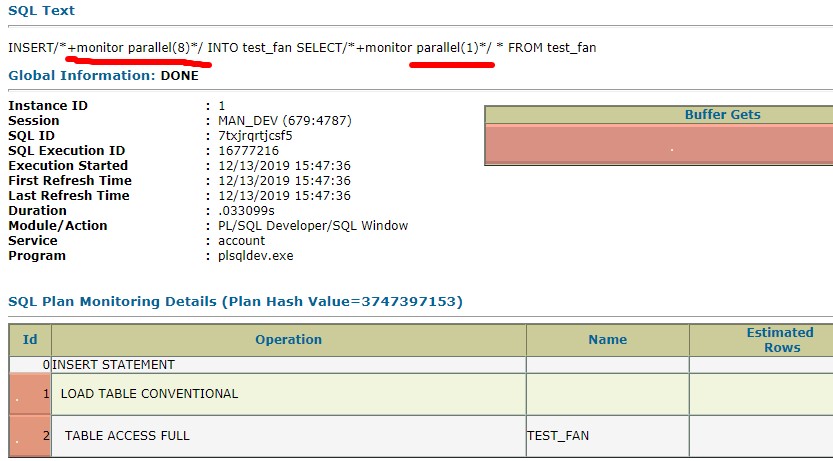
 3、monitor hint + dbms_sqltune.report_sql_monitor:
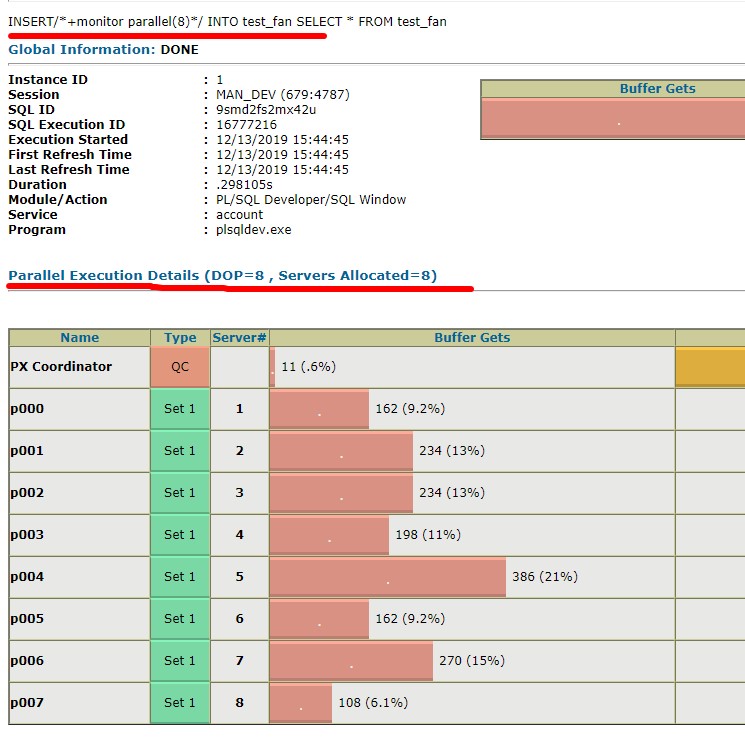
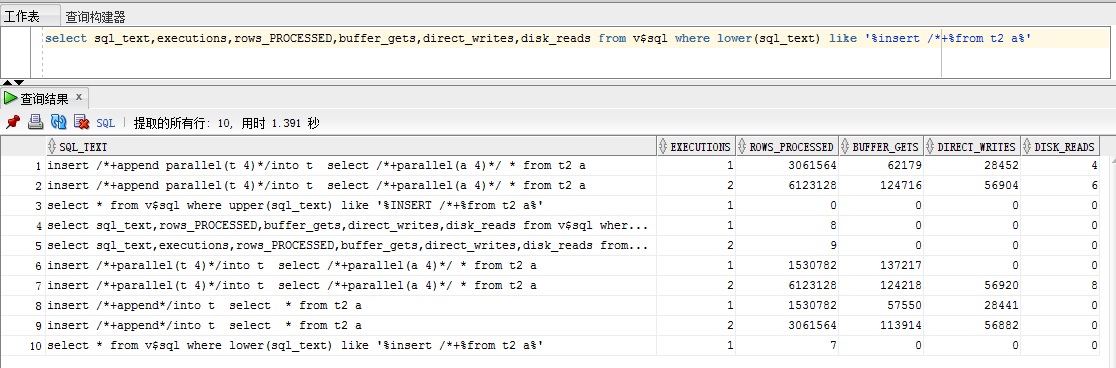
 这个可以看到并行器的使用情况[/quote]
没有打开parallel dml?否则应该不会是传统load方式
这个可以看到并行器的使用情况[/quote]
没有打开parallel dml?否则应该不会是传统load方式