FZU-SE-EE308-2022秋

LAB3-2-The Third Sprint Log
 墨衍会员 · AI 创作全网分发 墨衍智能分发 通过墨衍一键同步至各平台 可同步平台 CSDN微信公众号微博知乎掘金百家号博客园抖音小红书 你的文章也可以这样分发 墨衍会员 ¥399起/年,写一次发全网
我也要 关注 + 加入社区
墨衍会员 · AI 创作全网分发 墨衍智能分发 通过墨衍一键同步至各平台 可同步平台 CSDN微信公众号微博知乎掘金百家号博客园抖音小红书 你的文章也可以这样分发 墨衍会员 ¥399起/年,写一次发全网
我也要 关注 + 加入社区LAB3-2-Summary
| The Link Your Class | https://bbs.csdn.net/forums/MUEE308FZU202201 |
|---|---|
| The Link of Requirements of This Assignment | https://bbs.csdn.net/topics/610142480 |
| TeamName | 福大运会助手开发组 |
| Sprint Summary Link | https://bbs.csdn.net/topics/611340150 |
| Video demo link | https://www.bilibili.com/video/BV1S3411Q7rL/?pop_share=1 |
| GitHub | https://github.com/Group08-Tt/sportsmeeting |
The Third Sprint Log
1.The progress of this sprint
| Name | Tasks Completed | The duration of the task |
|---|---|---|
| Kaixi Chen(leader) | Start making the demo video. | 4 |
| Chenyu Yan | Develop the express code, debug bugs in the athlete information management function on the back end. | 5 |
| Zichen Huang | Writing proposal reports. | 3 |
| Yu Zhou | Writing the uniapp code to develop the check-in function on the front end. | 5 |
| Jiaqi Wu Le | Debug the ability to manage event information on the back end. | 20 |
| Yuzhe Zhang | Writing the uniapp code to develop the check-in function on the front end. | 5 |
| Wenjie She | Develop the node code on the back end. | 10 |
| Jingyu Qing | Discuss the problems in building the sports meeting app | 5 |
| Yangkun Xie | Research and development vs code software. | 5 |
| Jiewen Liu | Discuss the problems in building the sports meeting app | 5 |
Problems encountered
1.How to upload files
2.In the background of vue, there are many common problems of data transmission.
How to solve this problem
1.Through online review, we discussed that we need to upload the file to the server through the post request multer package for storage.
2.Through consulting materials, discuss together. It uses the vuex data sharing method. Previously, it used to store data directly. When it was used, it directly stored values. However, there would be many drawbacks.
2.record of the stand-up meeting
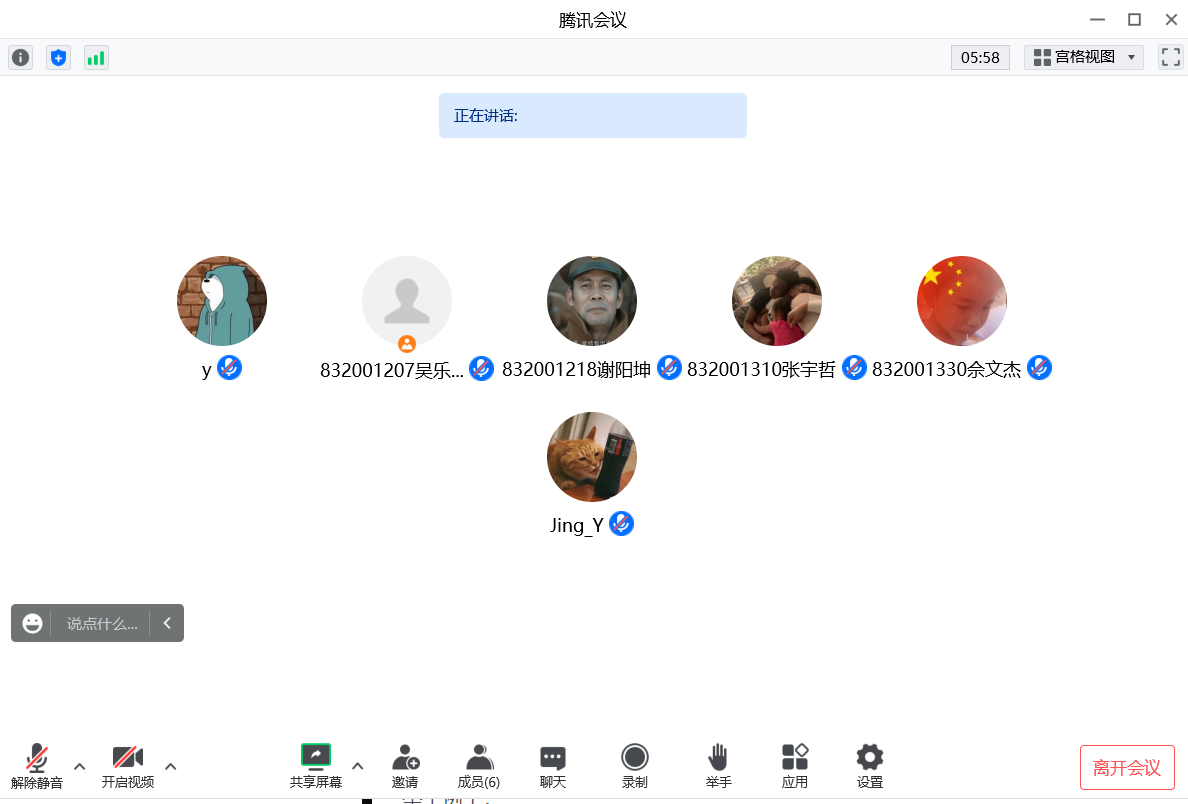
Everyone introduced their achievements and difficulties, and we discussed what we will do in the next two days
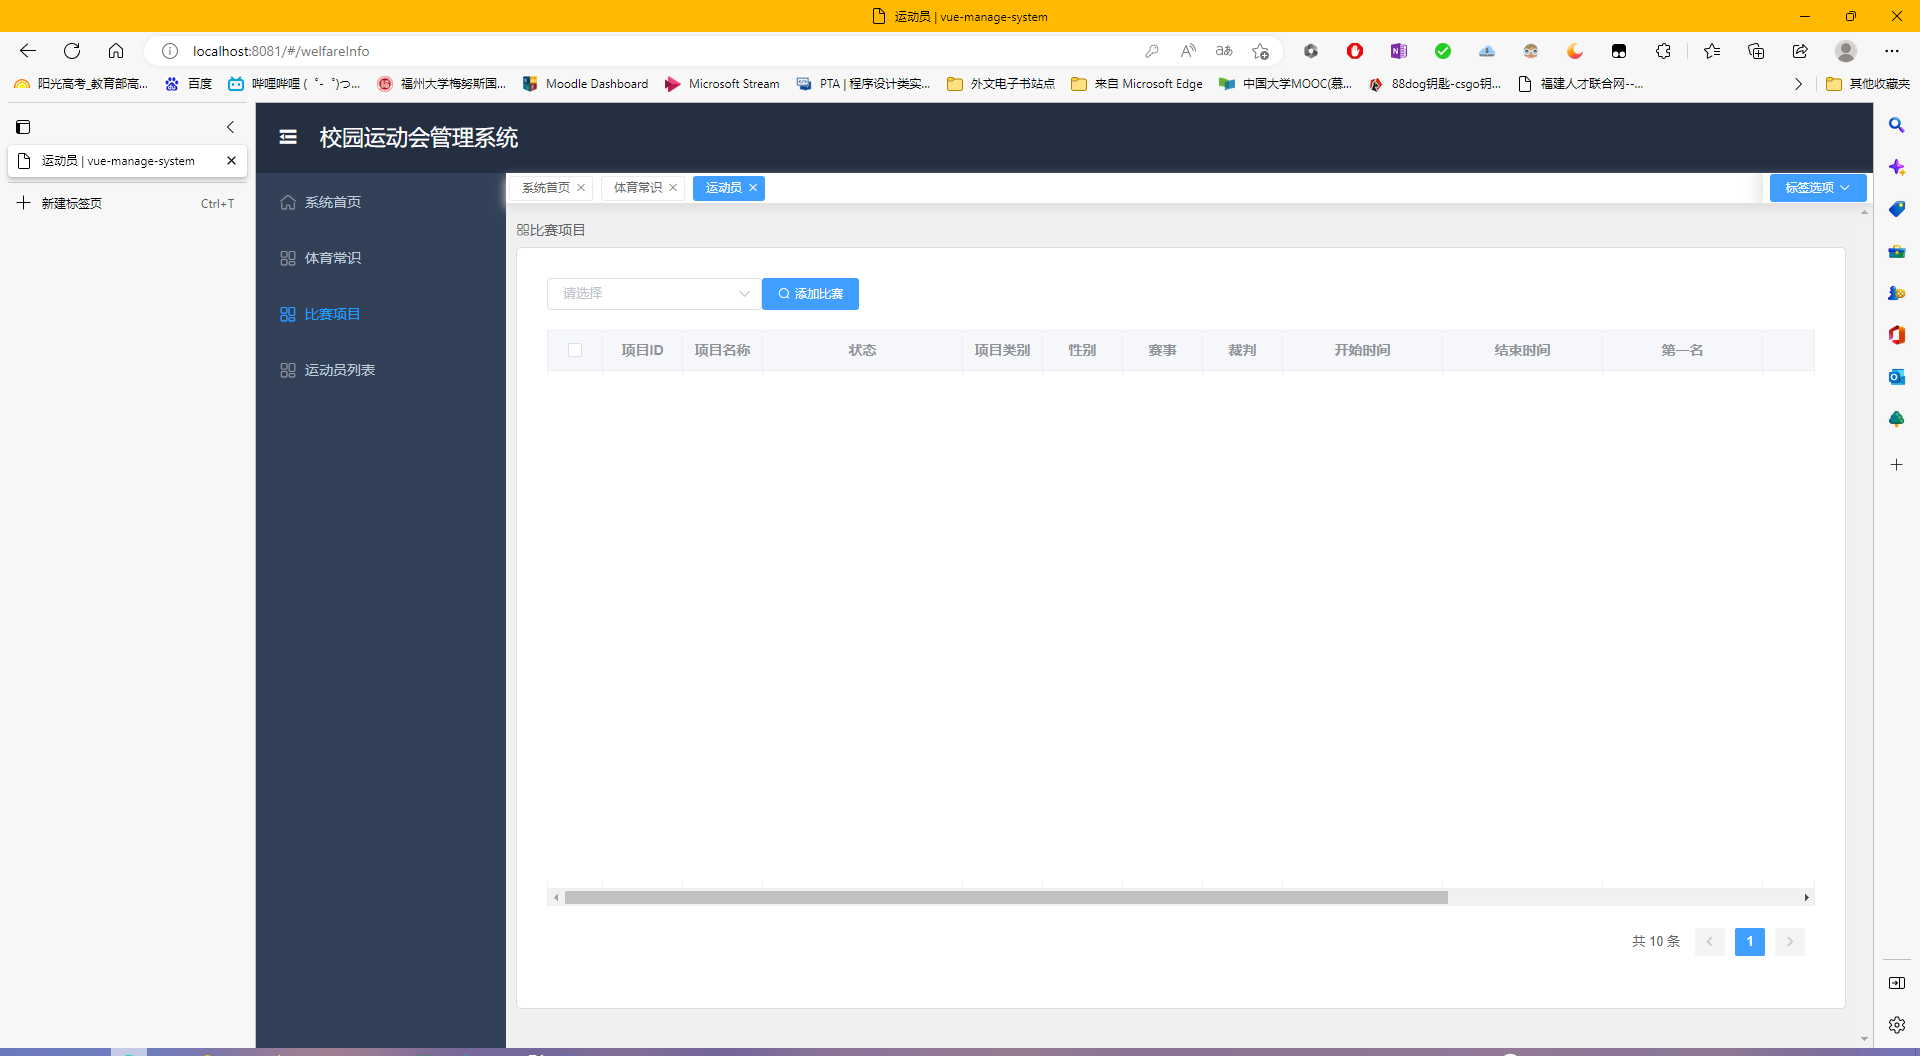
3.Development Process
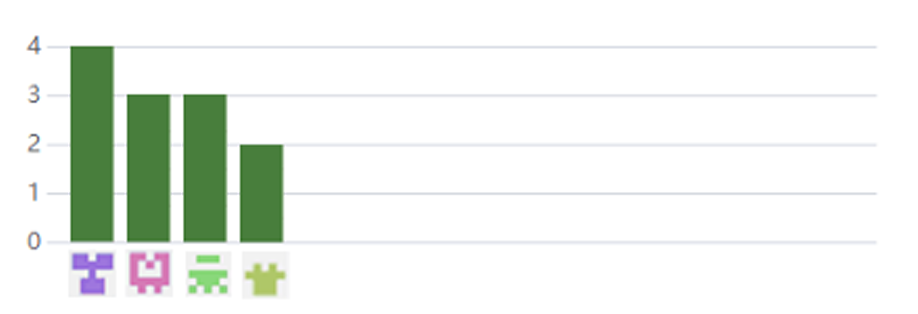
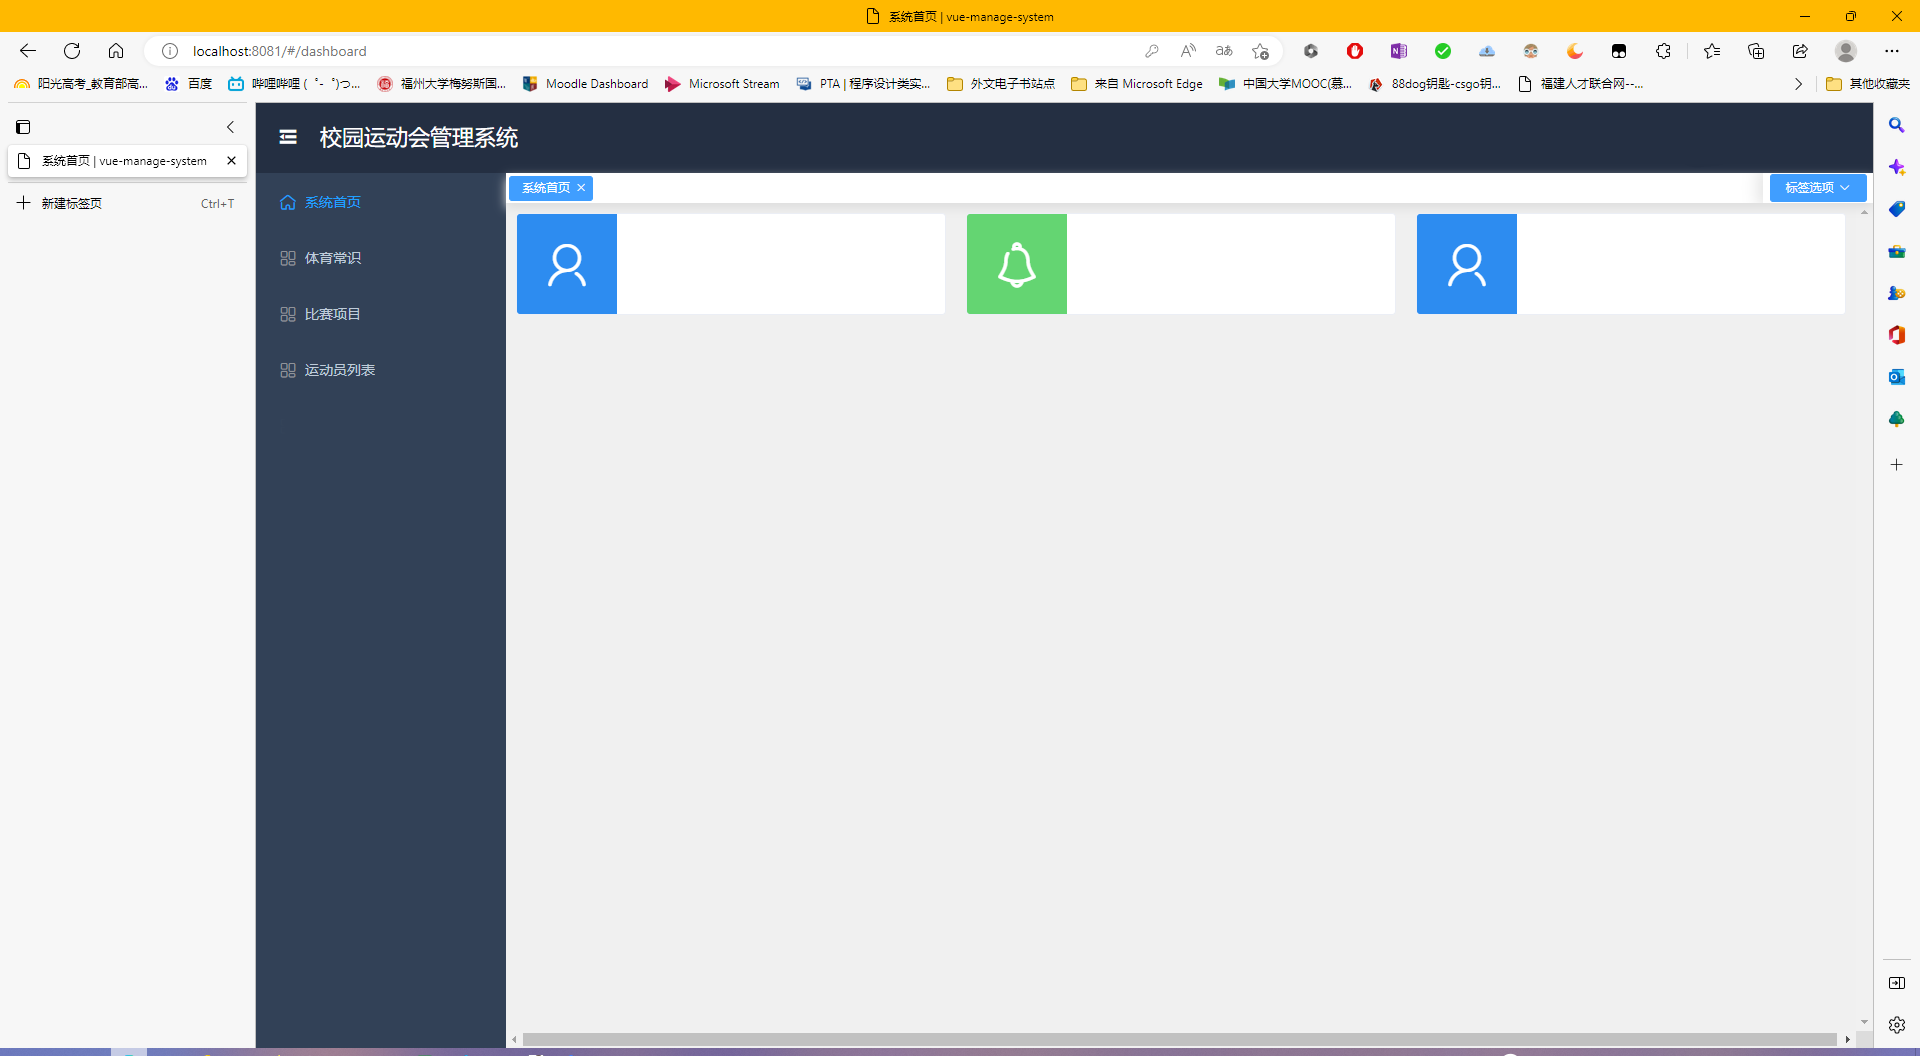
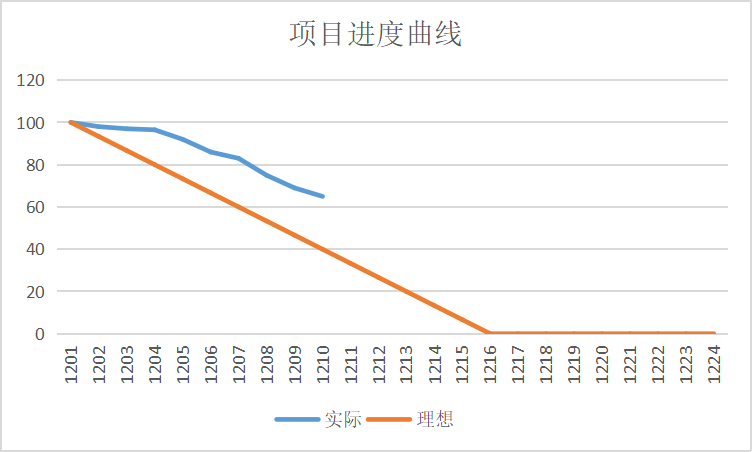
4.Team member contribution table
| Member | Proportion |
|---|---|
| Kaixi Chen | 105% |
| Chenyu Yan | 115% |
| Zichen Huang | 100% |
| Yu Zhou | 80% |
| Jiaqi Wu Le | 120% |
| Yuzhe Zhang | 80% |
| Wenjie She | 105% |
| Jingyu Qing | 100% |
| Yangkun Xie | 90% |
| Jiewen Liu | 105% |
| Total | 1000% |
相关推荐
政府科技管理者在推动科技成果转化过程中,如何精准匹配供需双方并提高对接效率?.docx
政府科技管理者在推动科技成果转化过程中,如何精准匹配供需双方并提高对接效率?
密码学基于大整数模运算的减法操作序列分析:4096位输入在固定模数下的逐步约简过程研究
内容概要:该文档记录了对一个大整数模运算(mod 4096)过程中连续减法操作的详细执行过程,主要围绕输入值与固定大数N之间的多次减法运算展开。文档展示了每轮减法前的临时值(temp)、当前N的十六进制表示以及两者的差值(diff),并标注了具体的减法编号、计算周期和输入位位置。整个过程共涉及上千次减法尝试,最终得到一个非负余数结果(FINAL),表明这是某种高精度模减算法(如Montgomery Reduction或类似逐位迭代方法)的实现追踪。文档的核心是展示大数模运算中逐步逼近余数的计算轨迹,强调二进制高位对齐下的条件
基于转子磁场定向的飞轮储能机侧PQ控制与网侧恒压双闭环协调策略研究(Simulink仿真实现)
内容概要:本文研究了基于转子磁场定向的飞轮储能系统在机侧与网侧的协调控制策略,重点实现了机侧PQ控制与网侧恒压双闭环控制的Simulink仿真实现。通过转子磁场定向技术,对飞轮储能系统的有功与无功功率进行精确解耦控制,有效提升了系统在并网运行时的稳定性与动态响应性能。网侧采用恒压双闭环控制策略,确保直流母线电压稳定,实现能量的高效双向流动。文中详细阐述了控制策略的设计原理、数学建模过程及仿真模型的构建方法,并通过仿真验证了该协调策略在功率平滑、电压支撑、动态调节及系统稳定性方面的有效性。; 适合人群:具备电力电子、电力系统或自动控制基础知识,从事新能源储能系统、飞轮储能技术、电力系统仿真等相关领域研究的研究生、科研人员及工程技术人员。; 使用场景及目标:① 掌握飞轮储能系统在并网工况下的机侧PQ解耦控制原理;② 学习基于转子磁场定向的矢量控制方法在储能系统中的应用;③ 实现并优化机侧与网侧双闭环协调控制策略,提升系统动态性能与稳定性;④ 为后续开展混合储能系统、微电网能量管理及高比例可再生能源接入系统的控制研究提供技术基础与仿真参考。; 阅读建议:建议结合Simulink仿真模型逐步理解控制结构设计,重点关注坐标变换、PI控制器参数整定、双闭环耦合关系及仿真结果分析,可尝试修改控制参数或工况设置以深入掌握系统响应特性。
2026海南省行政区划矢量图层-省市县乡镇四级行政区划数据下载
2026最新海南省行政区划矢量图层数据,包含省、市、县、乡镇四级行政区划数据,wgs84坐标
政府科技管理者如何优化科技成果评价与筛选流程?.docx
政府科技管理者如何优化科技成果评价与筛选流程?