


69,512
社区成员
 发帖
发帖 与我相关
与我相关 我的任务
我的任务
 分享
分享
画x+y=5的函数图像python代码:
import numpy as np
import matplotlib.pyplot as plt

# 创建x的范围
x = np.linspace(0, 5, 100)

# 计算对应的y值
y = 5 - x

# 创建图形并绘制函数曲线
plt.plot(x, y, label='x+y=5')

# 添加图例和标题
plt.legend()
plt.title('Graph of x+y=5')

# 显示图形
plt.show()
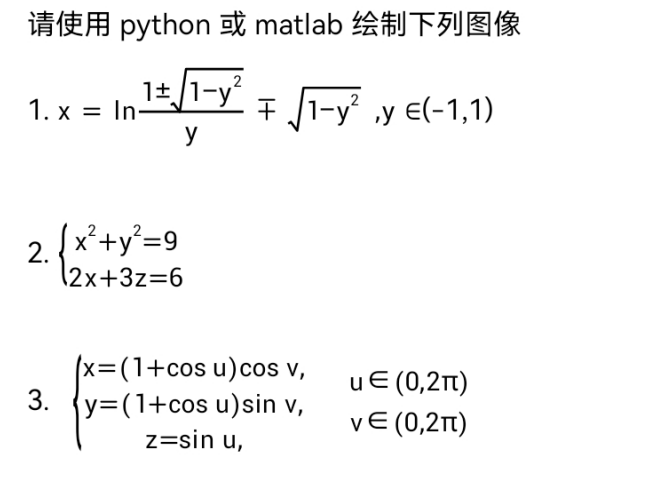
以此为基础,画出你的需求图像

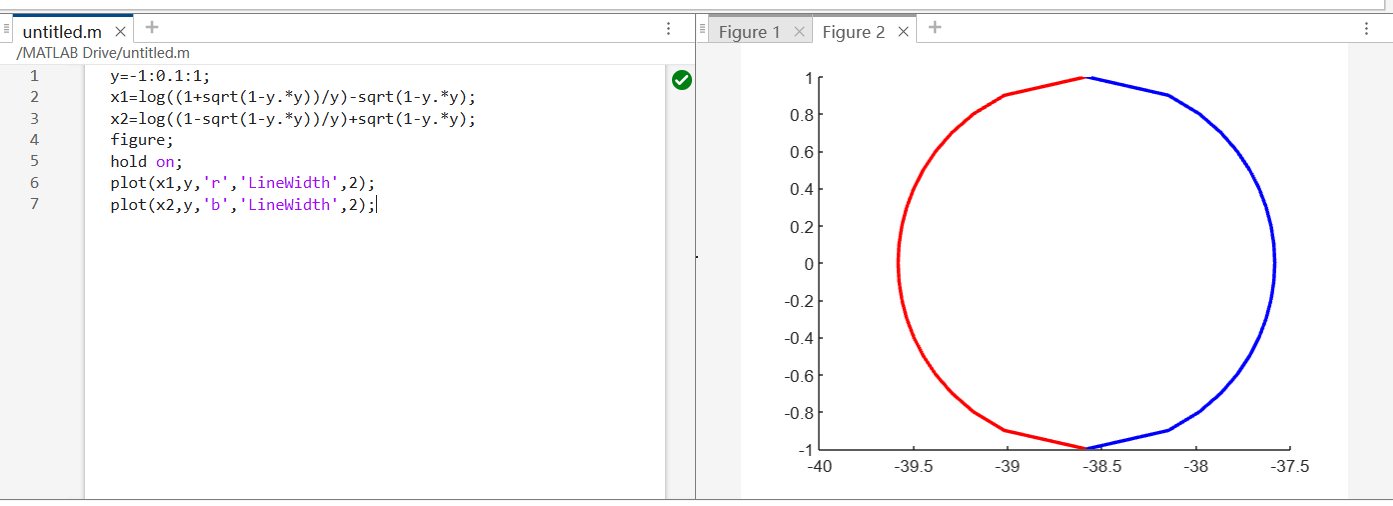
matlab比较擅长画函数曲线,画了第一题当个例子。代码:
y=-1:0.1:1;
x1=log((1+sqrt(1-y.*y))/y)-sqrt(1-y.*y);
x2=log((1-sqrt(1-y.*y))/y)+sqrt(1-y.*y);
figure;
hold on;
plot(x1,y,'r','LineWidth',2);
plot(x2,y,'b','LineWidth',2);
结果: