


164
社区成员
 发帖
发帖 与我相关
与我相关 我的任务
我的任务
 分享
分享
Yitan Fang
Fuzhou University (832302110) | Maynooth University (23125578)
| Item | Details |
|---|---|
| Course Link | 2025 Fall - Software Engineering Class |
| Assignment | Team Project - Alpha Sprint Blog |
| Team Name | FocusFlow |
| Sprint Goal | Finalizing the Alpha phase, delivering User Study Reports and Cross-Platform Data Sync. |
| References | IEEE Std 830-1998, GB/T 8567-2006 |
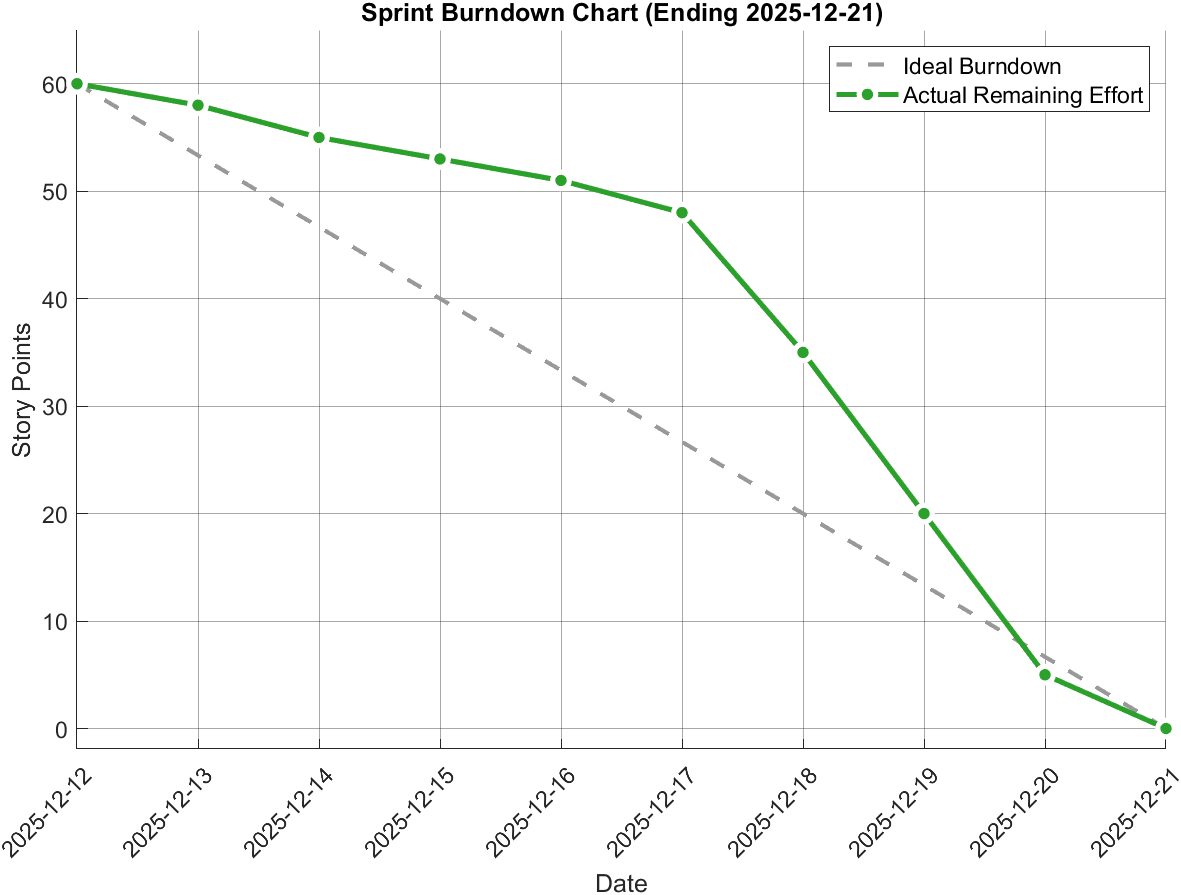
During this sprint cycle, we focused on tackling the challenges of data visualization and backend synchronization. The chart below illustrates the team's remaining effort (Story Points) over time.
💡 Insight:
As seen in the chart, we encountered technical bottlenecks in the middle of the sprint (flattened curve), but through intensive team collaboration in the final days, we successfully returned to the ideal burndown path.
We have completed the deep development of the "Study Report" and deployed the "Data Synchronization" feature. Through responsive design (RWD) and backend sync mechanisms, we ensure a seamless user experience across PC and mobile devices.
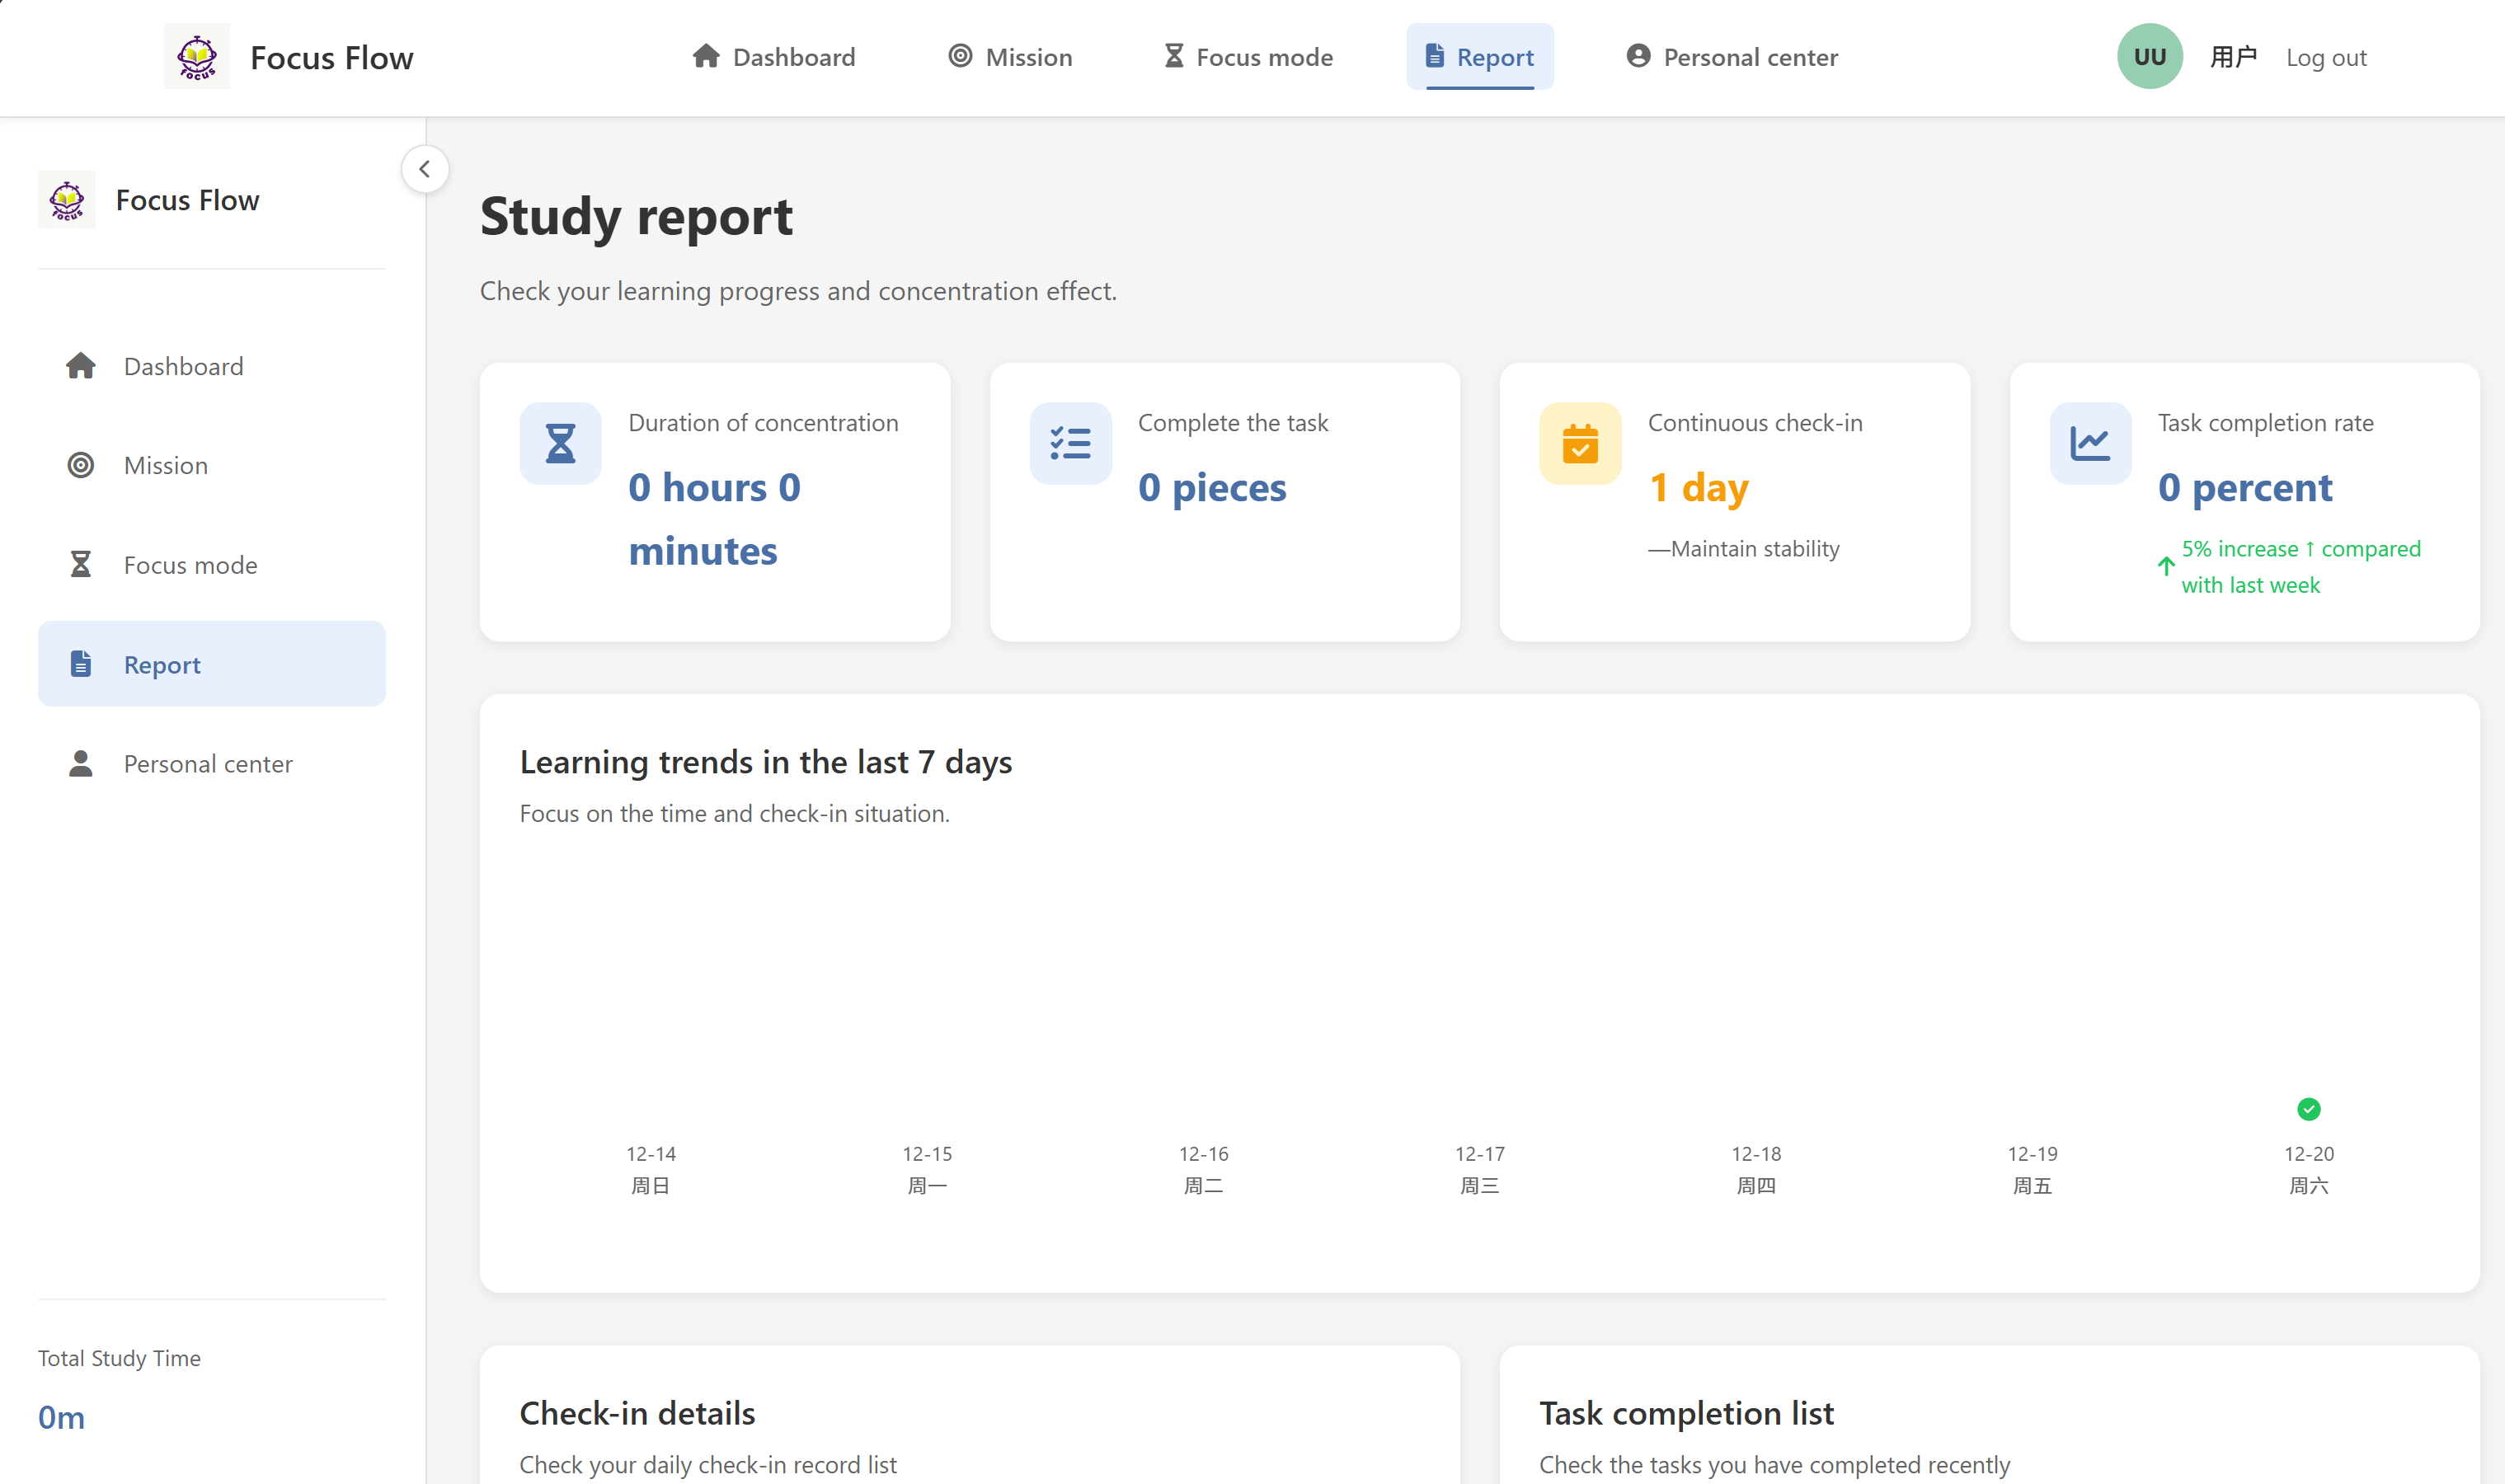
The Study Report is a core feature helping users review their progress. The system uses a card-based layout and trend charts to visualize learning status.
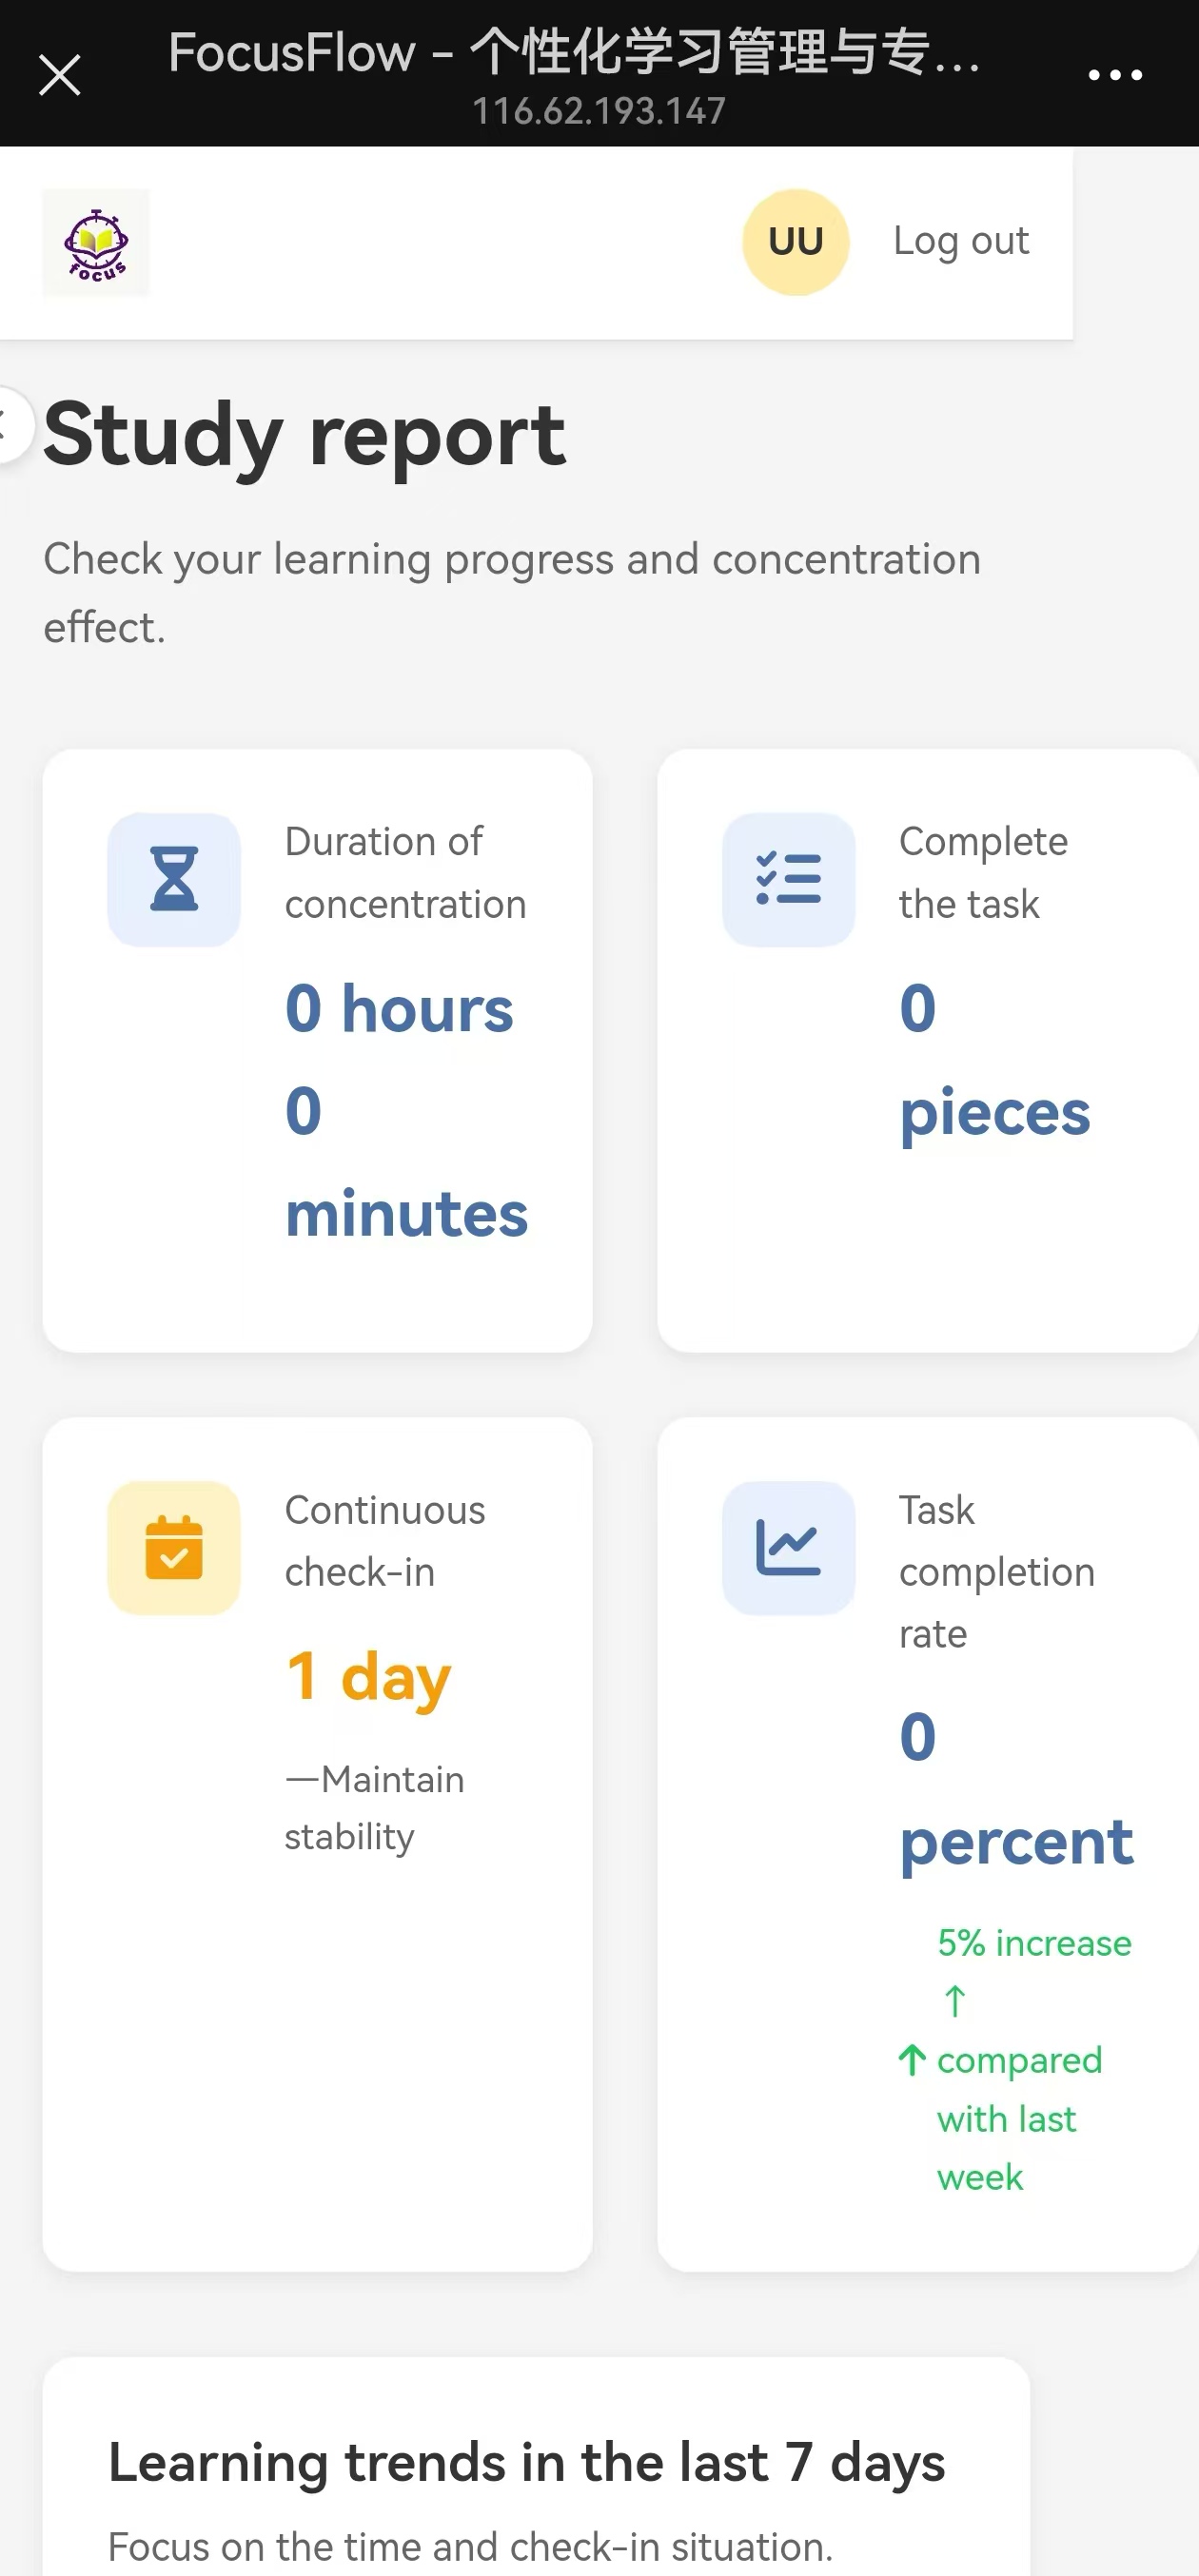
To support users in various scenarios (commuting, library, etc.), we implemented real-time cloud synchronization and mobile adaptation.
Our development process strictly follows the Git Flow workflow. Below are the commit records for the core features (Report Module & Data Sync).
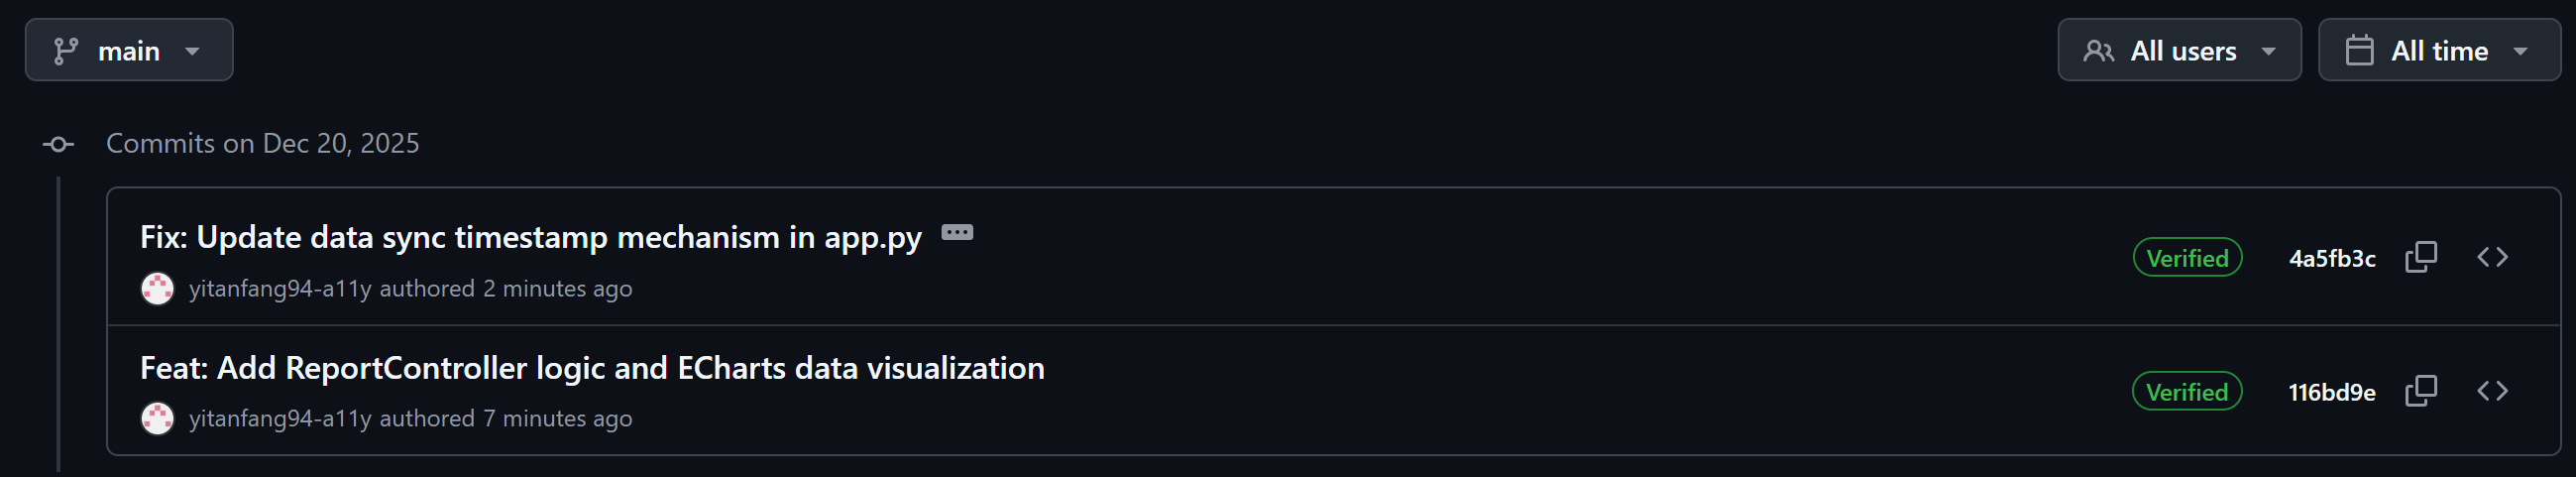
Key Commits Explanation:
Feature: Report VisualizationReportController logic, implemented backend encapsulation for ECharts data.main.Feature: Mobile Responsive LayoutThis task involved significant data aggregation and backend logic. Below is an analysis of the key code segments.
models.py)# Aggregate logic for user report data
def get_user_report_stats(user_id):
today = datetime.now().date()
# 1. Calculate streak days (Reusing previous logic)
streak_days = calculate_streak(user_id)
# 2. Statistics for today/cumulative focus time
# 💡 Optimization: Use SQL SUM aggregation to improve performance
# and avoid iterating through large datasets in the application layer.
focus_stats = db.execute('''
SELECT
SUM(duration) as total_minutes,
COUNT(*) as session_count
FROM focus_sessions
WHERE user_id = ?
''', (user_id,)).fetchone()
# 3. Calculate Week-over-Week (WoW) growth
last_week_stats = get_last_week_stats(user_id)
growth_rate = calculate_growth(focus_stats['total_minutes'], last_week_stats['total_minutes'])
return {
"streak": streak_days,
"total_focus": focus_stats['total_minutes'] or 0,
"growth_rate": growth_rate,
"completed_tasks": count_completed_tasks(user_id)
}
app.py)@app.route('/report', methods=['GET'])
@login_required
def report_page():
user_id = session.get('user_id')
# Fetch pre-calculated statistical data from backend
stats = get_user_report_stats(user_id)
# Get 7-day trend data for frontend chart rendering
trend_data = get_7day_trend(user_id)
# Render template. The Jinja2 engine combined with Bootstrap
# will handle the responsive layout classes automatically.
return render_template('report.html',
stats=stats,
trend_data=json.dumps(trend_data),
user=get_current_user())
| Challenge | Solution |
|---|---|
| 📉 Mobile Chart Adaptation | Widescreen charts looked crowded on phones. Fix: Used CSS Media Queries to detect screen width, hiding non-essential axis labels and adjusting chart height on mobile. |
| ⚡ Aggregation Performance | Page load slowed down as records increased. Fix: Introduced a caching mechanism to cache historical data (prior to "today") and only calculate today's increments in real-time. |
| 🔄 State Synchronization | PC did not refresh after mobile operations. Fix: Adopted an AJAX polling mechanism to periodically check data versions on the frontend. |
© 2025 FocusFlow Team. All Rights Reserved.


