求助!GEE-S1-后向散射-纹理提取,结果为空是为什么
社区首页 (3674)
 我加入的社区 我管理的社区 官方推荐社区
76
其他社区
3674
我加入的社区 我管理的社区 官方推荐社区
76
其他社区
3674
请编写您的帖子内容
社区频道(2)
显示侧栏
卡片版式
全部
Ada助手
最新发布
最新回复
标题
阅读量
内容评分
精选
393
评分
回复


求助!GEE-S1-后向散射-纹理提取,结果为空是为什么
求助帖!!!!各位老师们,能否帮我看看我这是什么问题?图像显示的区块和目标地不符合,导出的数据结果为空。这是哪一步出现了问题呢?烦请各位帮我瞅瞅,感谢!!!(90°鞠躬)
复制链接 扫一扫
分享

855
评分
4


osg对象拾取的问题 大佬来救救
我利用osg自带的 函数 实现了 点击鼠标画点 osgUtil::LineSegmentIntersector::Intersections intersections; if (mViewer->computeIntersections(x, y
复制链接 扫一扫
分享
652
评分
回复

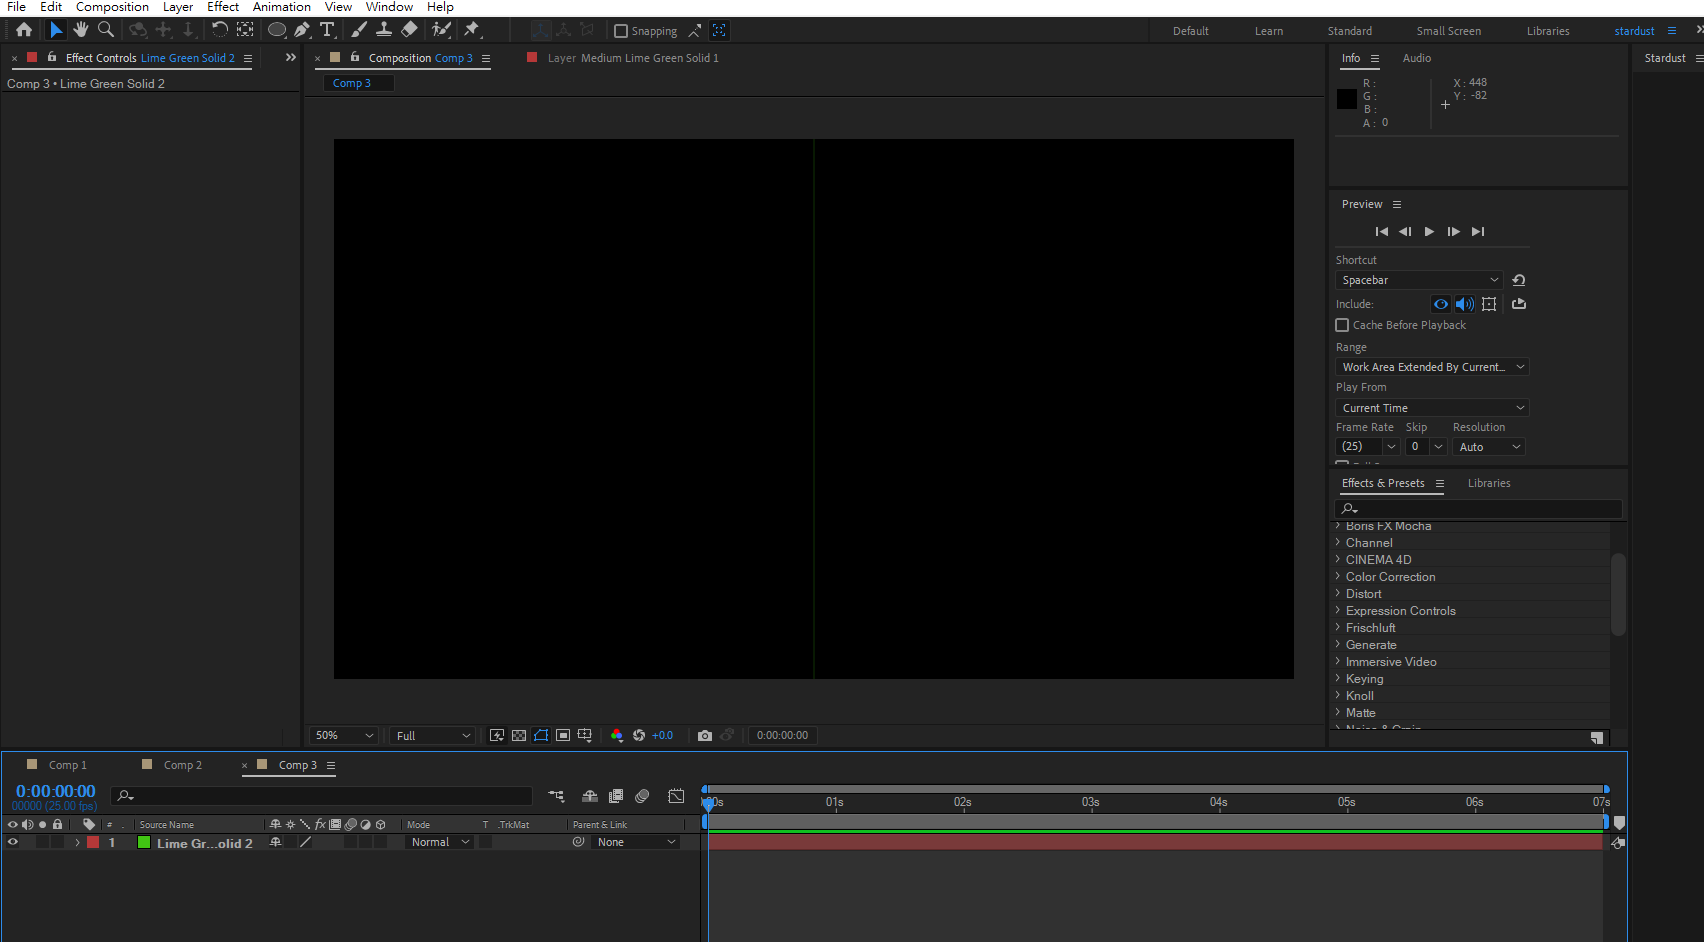
AE soild顏色跑不出來
我的插件 請問有大神知道是跟什麼插件產生衝突嗎?
复制链接 扫一扫
分享

1239
评分
1

为什么报错说串联的矩阵维度不一致啊??
function[gamma,Y,G]=LMI_01() %%程序参数初始化 C1=[0 0 1 0;0 0 0 1]; C=[0 1 0]; Mr=10; R=[1 0 0;0 1 0;0 0 1]; Q=[1 0 0;0 1 0;0 0
复制链接 扫一扫
分享
628
评分
回复


[Matlab]如何強化圖片內局部區域的對比度? 直方圖均衡化(Histogram Equalization)
人類文明伴隨著科技日新月異的發展,巨大的資訊量和永遠不夠用的時間的問題想必困擾著每個人。各種資訊平台,包含電子媒體的新聞發布或是智慧手機內的社群Apps和新聞雜誌Apps等等,大多採用圖像式的設計介面,讓使用者藉由圖像式閱讀以達到有效率地消化資訊。換句話說,圖像式閱讀儼然已成為現代人吸收資訊的方式之一。然而面對一張過暗或模糊的圖片,等同於無法正確取得圖片內含的資訊,勢必得經過一...
复制链接 扫一扫
分享

676
评分
回复

[Matlab]如何去除圖像中的椒鹽雜訊(1)? 均值濾波(mean filter)
仔細看,似乎有一些微小顆粒參雜在上圖,沒有錯,這在圖像處理領域中,一般被稱為椒鹽雜訊(salt & pepper noise)。其特點是以黑點或是白點形式呈現,形同一粒粒"黑色"胡椒或是"白色"鹽巴灑在圖片上。換句話說,以8位元灰階圖為例,像素灰階值範圍由0~255,"黑色"胡椒的數值是0,"白色"鹽巴的數值則為255。OK,如何消除這種令人感到雜亂的椒鹽雜訊,...
复制链接 扫一扫
分享
747
评分
1

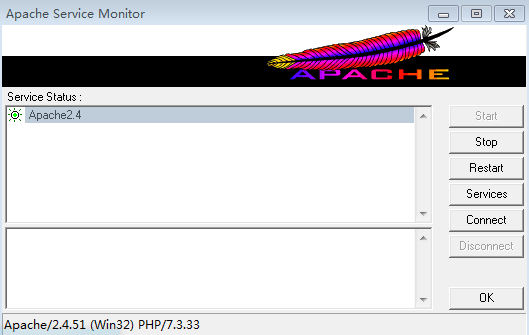
DW在设置数据库mysql连接时,出问题。
apache已开启 mysql已开启 DW已开启 问题在这里: 三个软件分别打开,在DW设置数据库时,出现错误提示:“你的PHP服务器没有加载mysql模块,或者你不能使用mysql(p)连接函数。“ 在不更换软件,不重新下载安装的情况
复制链接 扫一扫
分享
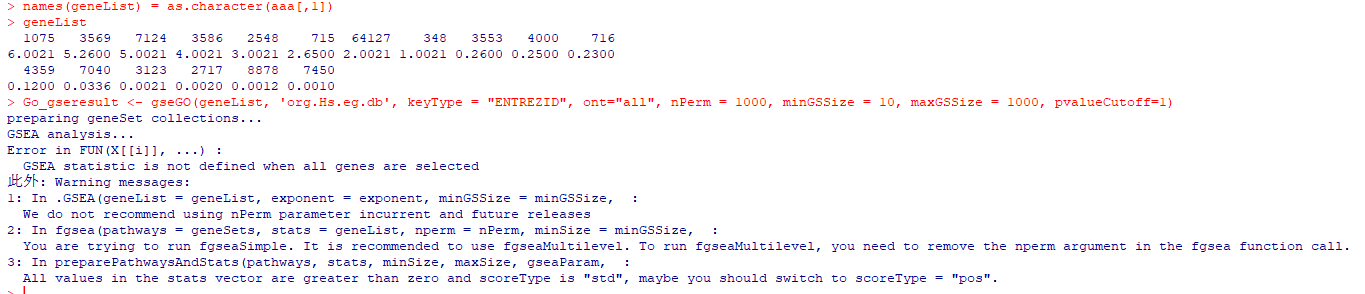
求助R语言GSEA分析
初学者,一直报错,球求大神指点迷津
...全文
666
评分
回复
求助R语言GSEA分析
初学者,一直报错,球求大神指点迷津
复制链接 扫一扫
分享
641
评分
回复
请问这个配置做效果图怎样
i5 10代 16G 240G+1T 七彩虹1650 4GD6独立显卡
复制链接 扫一扫
分享

664
评分
1
FrontPage2003 Dhtml效果预览不出?求高手指点!
当前页面的脚本发生错误。 20 179 属性“clickSwapStyle”的值为mull、未定义或不是Fun e tion对象 file:///C:/Users/Administrator/AppData/Local/Microsoft/ Windows /TemporaryX20Internet% 20Files/ FrontPage TempDir/pvw1.htm
复制链接 扫一扫
分享

903
评分
回复
Rstudio制图报错
再写r的时候出现问题了 我的代码是这个 library(ggplot2) ggplot(data = data, aes(x=date,y=price ,group=type,color=type),inherit.aes = FALSE )+ geom_line()+ geom_point()+ geom_smooth(method="lm") 已经可以生成图片了,但是我knit的时候显示 error in fun :找不到对象‘price’ 新手求助
复制链接 扫一扫
分享
668
评分
回复

August_LH留言板
Welcome~ 如有问题,欢迎留言~
复制链接 扫一扫
分享
1438
评分
1
ArcGIS shape area,shape leng等属性都为空,这是怎么回事?怎么改
[图片]
复制链接 扫一扫
分享
749
评分
回复

图案设计
用索引图像方式设计一段代码,生成某种图案的一块色布。必须包括但不限于:算法流程、matlab源代码、运行结果。
复制链接 扫一扫
分享
735
评分
回复
Canny 边缘检测算法分析与实现
对canny算法及原函数代码进行深入研究分析。 算法原理、原函数代码、对算法的分析及见解、运行结果
复制链接 扫一扫
分享

1758
评分
回复

matlab串联的矩阵的维度不一致
hf=figure('position',[200 200 600 400],'name','uicontrol1','numbertitle','off'); ha=axes('position',[0.4 0.1 0.5 0.7],'box','on'); hbsin=uicontrol(hf,'style','pushbutton','position',[50,140,100,30],'string','绘制sin(x)','callback',['subplot(ha);' 'x=0:
复制链接 扫一扫
分享
1409
评分
回复

ENVI计算NDVI的统计结果异常
ENVI计算NDVI的统计结果出现异常,所有数值都缩小了100倍,请教各位大佬,有什么解决的方案?
复制链接 扫一扫
分享

751
评分
回复

求助Linux版本的犀牛软件
想在大服务器上运行,只能是Linux系统的,有哪位大佬有?可以分享一下,非常感谢!
复制链接 扫一扫
分享

2522
评分
1
AE文件帮忙高版本转为低版本
链接:https://pan.baidu.com/s/1vfGsLYmKtILXXJfjrVOq2g 提取码:pjiw 我的是CS6,版本比较低,这个是由CC创建的
复制链接 扫一扫
分享
为您搜索到以下结果:


